The calendar year 2022 was difficult to navigate for most asset classes. To put it in perspective, it was the first calendar year on record that saw the S&P 500® Index and U.S. 10 Year Treasury Bonds both down double digits within the same year.
However, one investment category that was able to buck the downtrend in 2022 was Commodities. The notable passive long- only broad commodity indices all produced a positive return for the year. Specifically, the Direxion Auspice Broad Commodity Strategy ETF (COM) was +9.18% for 2022. The COM ETF seeks to track the Auspice Broad Commodity Index (ABCERI)*, which is a (long/flat) rules-based tactical broad commodity index.
Historically, commodities have shown a low correlation to stocks and bonds, and that proved to be the case this past year. The ability of commodities to provide an additional source of returns within an overall portfolio is one reason financial professionals look to incorporate them alongside traditional investments. The chart below shows that the ABCERI Index has a low correlation to most asset classes, including U.S. stocks and Bonds.
| Equities | Fixed Income | Managed Futures | REITs | Hedge Funds | Emerging | US Dollar | Natural Resources | MLP | |
| Commodities | 0.48 | -0.08 | 0.39 | 0.38 | 0.51 | 0.56 | -0.50 | 0.70 | 0.50 |
Source: Bloomberg. Date range: 9/30/2010-11/30/2022. Commodities represented by the Auspice Broad Commodity Excess Return Index
The biggest performance drivers were the results of the Energy and Agricultural sectors. The combination of China’s slow post-COVID economy reopening along with the onset of the Russia/Ukraine conflict in the first quarter of 2022 created some “supply shocks” in a number of commodity markets, most notably the Oil and Grain sectors. OPEC’s (Organization of the Petroleum Exporting Countries) continued stance of curtailing production has certainly exacerbated the potential supply issues. The geopolitical risk has tempered a bit over the last few months, but the ongoing conflict could keep a higher price floor in place particularly with energy and grain related commodities, as Ukraine and Russia are two of the biggest suppliers within these sectors.
The Metals sector certainly lagged for most of last year, as higher interest rates and a stronger U.S. Dollar kept a lid on Precious Metal prices. However, over the last few months, signs of a possibly less aggressive Fed tightening, combined with a retreat in the U.S. Dollar, has caused a rebound in Gold and Silver prices. In addition, the crypto fallout where the mantra of Bitcoin had been “digital gold” has seemed to subside and could result in potentially greater flows back in to true Precious Metals.
The resumption of an upward price trend in both Gold and Silver has coincided with the COM ETF recently reinstituting a Long position in each commodity. We will see if Precious Metals regain some of their luster in 2023, as their “flight to safety” allure eluded it in 2022.
In regards to Industrial Metal, Copper, struggled in the first half of the year largely due to the slow economy reopening in China and some concerns about global infrastructure initiatives becoming more muted as recession fears mount. However, after bottoming in the summer, Copper trended higher and was added back to the portfolio late in the year. Even though the health of China continues to be a bellwether for the price of Copper, one might now look to India as a gauge for commodities in general. India might soon overtake China and become the world’s largest population and biggest commodity consumer.
Although inflation has muted a bit over the last few months, it seems as if it will remain elevated for some time to come. The Fed is trying to play catch up with being aggressive in their rate increases. Historically, higher inflation has also coincided with rising interest rates. As an aside, with the current rising interest rate environment, this can represent a tailwind for commodity investing in general, and specifically for the COM ETF. One benefit of this environment is that the margin to equity when trading futures is low, meaning that there is a significant portion of Cash on hand, even when the strategy is fully invested. Additionally, when the strategy gets defensive as it did in 2022, when COM was completely in Cash, it can now potentially generate a higher yield.
Also with the rise in inflation, it has been an impetus for elevating commodity prices. As we touched on earlier, even in an inflationary environment such as 2022, it does not necessarily translate into every commodity rising in unison.
The ability of the Direxion Auspice Broad Commodity Strategy ETF (COM) to go to Cash with an individual commodity when it is showing a downward price trend was evident even last year as the strength of the broader commodity markets dissipated as the year went on.
We saw COM’s tactical strategy in action last year as the ABCERI Index was completely in Cash, for one of few times in its history. During the early part of the 4th quarter, each of the individual 12 commodities that make up the ABCERI index independently went to Cash based on price trends. However, as market conditions changed, COM showed its dynamic tactical nature by reinstituting five Long positions by year end (Soybeans, Gold, Silver, Copper, and Sugar). Volatility in commodities may continue as we move into 2023 and COM is well positioned to respond both offensively and defensively.
Over the last 2 years, Commodities have been one of the best performing asset classes. Some say we are still in the early stages of a commodity super cycle. Typically, commodity cycles tend to extend for years in either direction. Most recently, we are coming out of a lost decade in commodities from 2010-2020.
There are a number of factors that could be helping to support the current supercycle narrative. Some of these factors are highlighted in the graphic below:
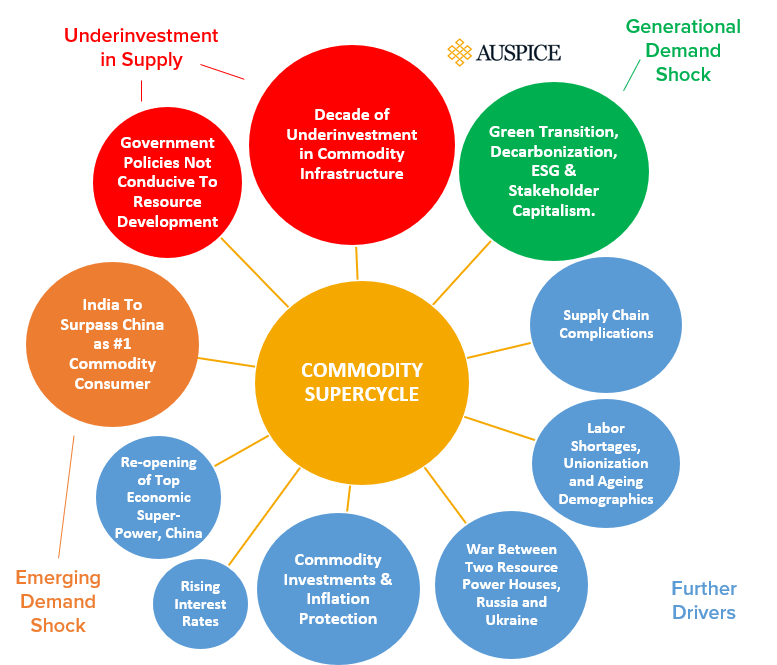
Source: Auspice Investment Operations
As we enter 2023, the Direxion Auspice Broad Commodity Strategy ETF (COM) has shown over time the potential ability to provide the majority of the commodity return stream while seeking to mitigate downside risk. The chart below reinforces this by illustrating the risk/return characteristics of the ABCERI index compared to other notable passive long only broad commodity benchmark peers since the Index inception on 9/30/2010. (See Chart below)
| ABCERI | S&P GSCI6 | BCOM7 | DBC CI8 | |
| Annualized Return2 | 1.96% | -2.30% | -1.54% | 1.00% |
| Annualized Standard Deviation3 | 8.99% | 21.73% | 14.76% | 17.67% |
| Correlation4 | 1.00 | 0.62 | 0.71 | 0.70 |
| Max Drawdown5 | -43.08% | -79.62% | -66.09% | -64.99% |
Please click here for standardized performance of the fund.
The performance data quoted represents past performance. Past performance does not guarantee future results. The investment return and principal value of an investment will fluctuate. An investor’s shares, when redeemed, may be worth more or less than their original cost. Current performance may be lower or higher than the performance quoted. Returns for performance under one year are cumulative, not annualized.
Short-term performance, in particular, is not a good indication of the fund’s future performance, and an investment should not be made based solely on returns. Because of ongoing market volatility, fund performance may be subject to substantial short-term changes. For additional information, see the fund’s prospectus.
*Definitions
The Auspice Broad Commodity Index (ABCERI) is a rules-based long/flat broad commodity index that seeks to capture the majority of the commodity upside returns, while seeking to mitigate downside risk. The Index is made up of a diversified portfolio of 12 commodities futures contracts (Silver, Gold, Copper, Heating Oil, Natural Gas, Gasoline, Crude Oil, Wheat, Soybeans, Corn, Cotton, and Sugar) that based on price trends can individually be Long or Flat (in Cash). One cannot directly invest in an index.
1 Source: Bloomberg
2Annualized Return and past performance does not guarantee future results. Index returns and correlations are historical and are not representative of any Fund performance. Total returns of the Index include reinvested dividends. One cannot invest directly in an index. 3Standard Deviation is a measure of the dispersion of a set of data from its mean. 4Correlation is a statistical measure of how two securities move in relation to each other.5Maximum Drawdown is the greatest percent decline from a previous high. 6S&P GSCI Excess Return Index (S&P GSCI), a composite index of commodity sector returns representing an unleveraged, long-only investment in commodity futures that is broadly diversified across the spectrum of commodities; 7Bloomberg Commodity Excess Return Index (BCOM), a broadly diversified index that allows investors to track 19 commodity futures through a single, simple measure, and 8Deutsche Banc Liquid Commodity Optimum Yield Index (DBC CI), an index composed of futures contracts on 14 of the most heavily-traded and important physical commodities in the world.
An investor should carefully consider the Fund’s investment objective, risks, charges, and expenses before investing. The Fund’s prospectus and summary prospectus contain this and other information about the Direxion Shares. To obtain the Fund’s prospectus and summary prospectus call 866-476-7523 or visit our website at direxion.com. The Fund’s prospectus and summary prospectus should be read carefully before investing.
Futures may be affected by backwardation or contango. Backwardation is a market condition in which a futures price is lower in the distant delivery month than in the near delivery month. Contango is a market condition in which the futures price is higher in the distant delivery month than in the near delivery month. In cases of contango, the Fund's total return may be lower than might otherwise be the case because the Fund would be selling less expensive contracts and buying a more expensive ones.
Direxion Shares Risks - An investment in the Fund involves risk, including the possible loss of principal. The Fund is non-diversified and includes risks associated with concentration that results from the Fund’s investments in a particular industry, sector, or geographic region which can result in increased volatility. The Fund’s use of derivatives such as futures contracts and swaps are subject to market risks that may cause their price to fluctuate over time. Risks of the Fund include risks related to investments in commodity-linked derivatives and commodities, Futures Strategy Risk, Index Correlation Risk, Index Strategy Risk, Leverage Risk, Market Risk, Counterparty Risk, Cash Transaction Risk, Subsidiary Investment Risk, Interest Rate Risk, and Tax Risk. Please see the summary and full prospectuses for a more complete description of these and other risks of the Fund.
Exchange-traded commodity futures contracts generally are volatile and are not suitable for all investors. The value of a commodity-linked derivative investment typically is based upon the price movements of a physical commodity and may be affected by changes in overall market movements, volatility of the index, changes in interest rates, or factors affecting a particular industry or commodity, such as global pandemics, weather and other natural disasters, changes in supply and production, embargoes, tariffs and international economic, political and regulatory developments and changes in speculators’ and/or investors’ demand. Commodity-linked derivatives also may be subject to credit and interest rate risks that in general affect the value of debt securities. The Fund’s investments in derivatives may pose risks in addition to, and greater than, those associated with directly investing in securities or other investments.
Risks associated with the use of futures contracts are (a) the imperfect correlation between the change in market value of the instruments held by the Fund and the price of the futures contract; (b) possible lack of a liquid secondary market for a futures contract and the resulting inability to close a futures contract when desired; (c) losses caused by unanticipated market movements, which are potentially unlimited; (d) the Index’s inability to predict correctly the direction of securities prices, interest rates, currency exchange rates and other economic factors; (e) the possibility that the counterparty will default in the performance of its obligations; and (f) if the Fund has insufficient cash, it may have to sell securities or financial instruments from its portfolio to meet daily variation margin requirements, which may lead to the Fund selling securities or financial instruments at a time when it may be disadvantageous to do so. Auspice Capital Advisors Ltd. is a registered Portfolio Manager/Investment Fund Manager in Canada and a registered Commodity Trading Advisor (CTA/CPO) and National Futures Association (NFA) member in the US.
For Financial Professional use only
Distributor: Foreside Fund Services, LLC