Interest Rates A-Rising–Impact on Growth vs Value ETFs

David Mazza, Managing Director, Head of Product
Rising Rates: Impact on Growth ETFs vs Value ETFs
To say the last year was unfriendly to thematic, disruptive growth ETFs, like the Direxion Moonshots ETF (MOON), Work From Home ETF (WFH) or Hydrogen ETF (HJEN) would be an understatement. Disruptive and thematic ETFs have been punished to an even greater extent, considering many of them offer exposure to stocks with high expected revenue growth. The words of John Fogerty, of Creedence Clearwater Revival, sum up the situation well.
I see the bad moon a-rising
I see trouble on the way
I see earthquakes and lightnin’
I see bad times today
The primary culprit for “bad moon” is higher interest rates, especially real rates driven by hawkish turns from the global central banks, which are trying to thread the needle between dampening inflationary pressures and crimping economic growth. January’s read of core inflation in the US was the highest since 1984, which is only helping accelerate the case for the Federal Reserve to increase the Fed Funds Rate.
Short-Term Interest Rates Have Increased Sharply
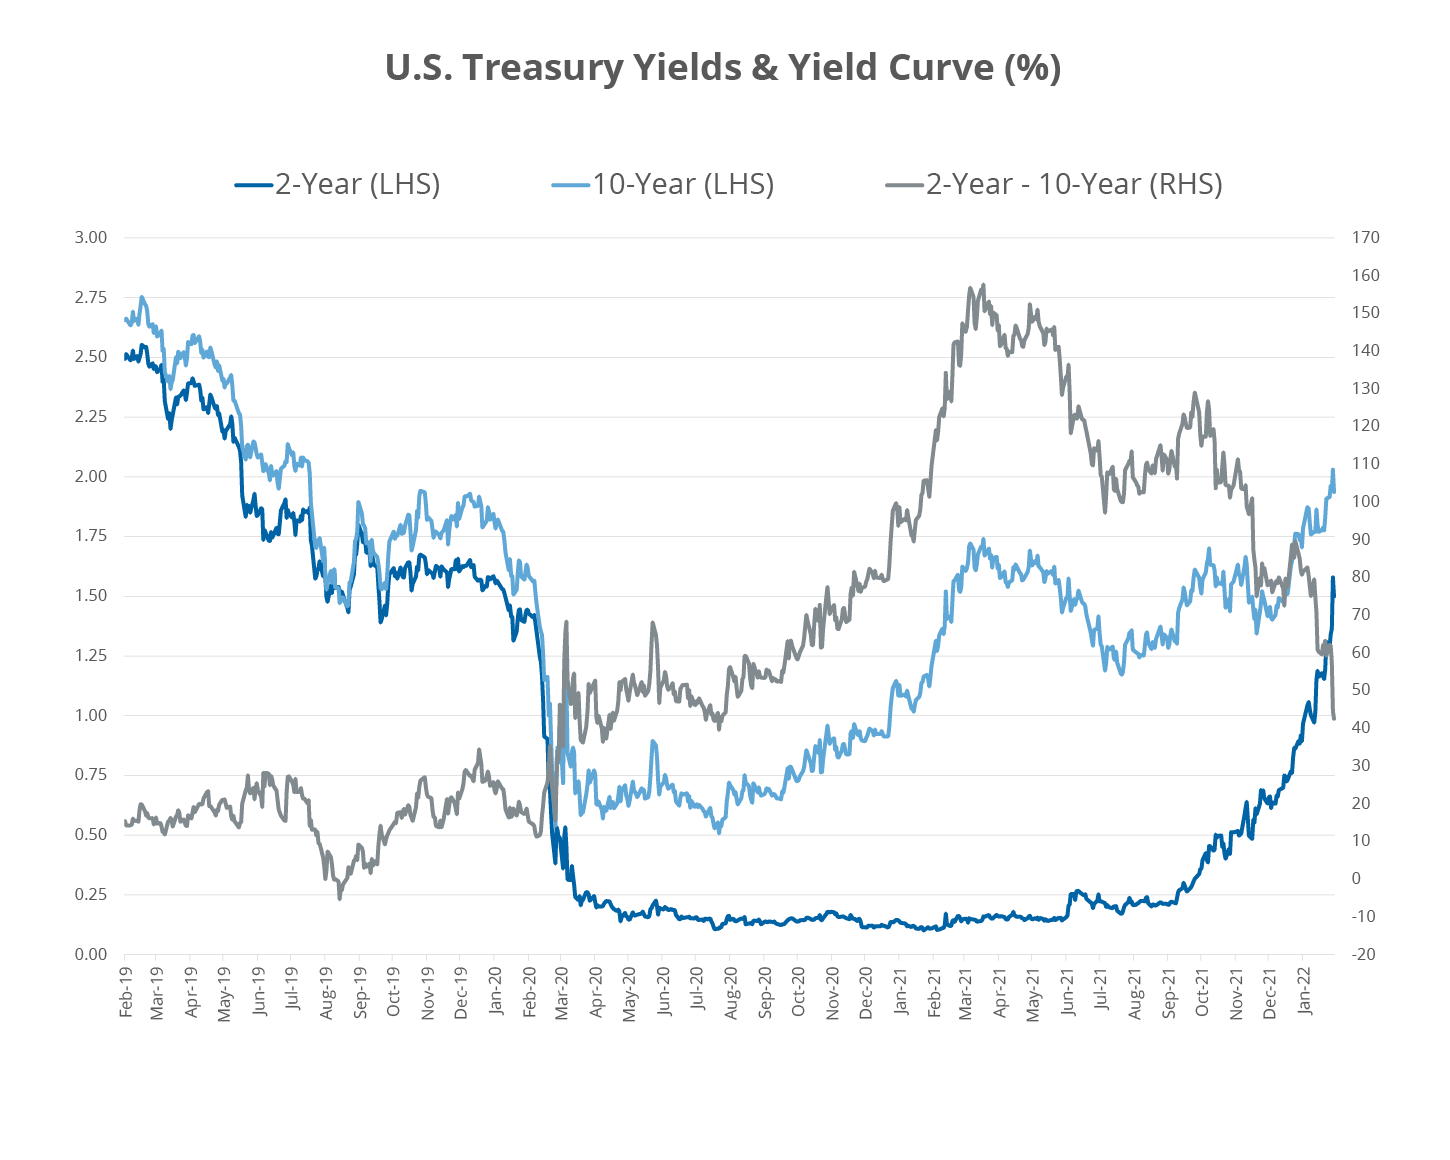
Source: Bloomberg Finance, L.P., as of February 11, 2022.
What’s the big deal with rising rates anyway?
Higher real rates hurt stocks with the highest valuation multiples the most. While there are numerous technical factors behind how high interest rates impact stock market valuations, one of the simplest to understand relates to the discounting of future cash flows. Generally, higher interest rates lead to lower stock prices as cash flows are discounted at higher rates. Growth stocks tend to be more vulnerable to higher rates as revenue and earnings several years in the future become less valuable in today’s dollars.
While not as extreme as the tech bubble of late 1990s, the relative valuation of growth stocks compared to value stocks is elevated. Even with the recent selloff, growth names continue to sport high price multiples, which makes them vulnerable to further moves higher in rates.
Valuations Remain Elevated for Growth Stocks
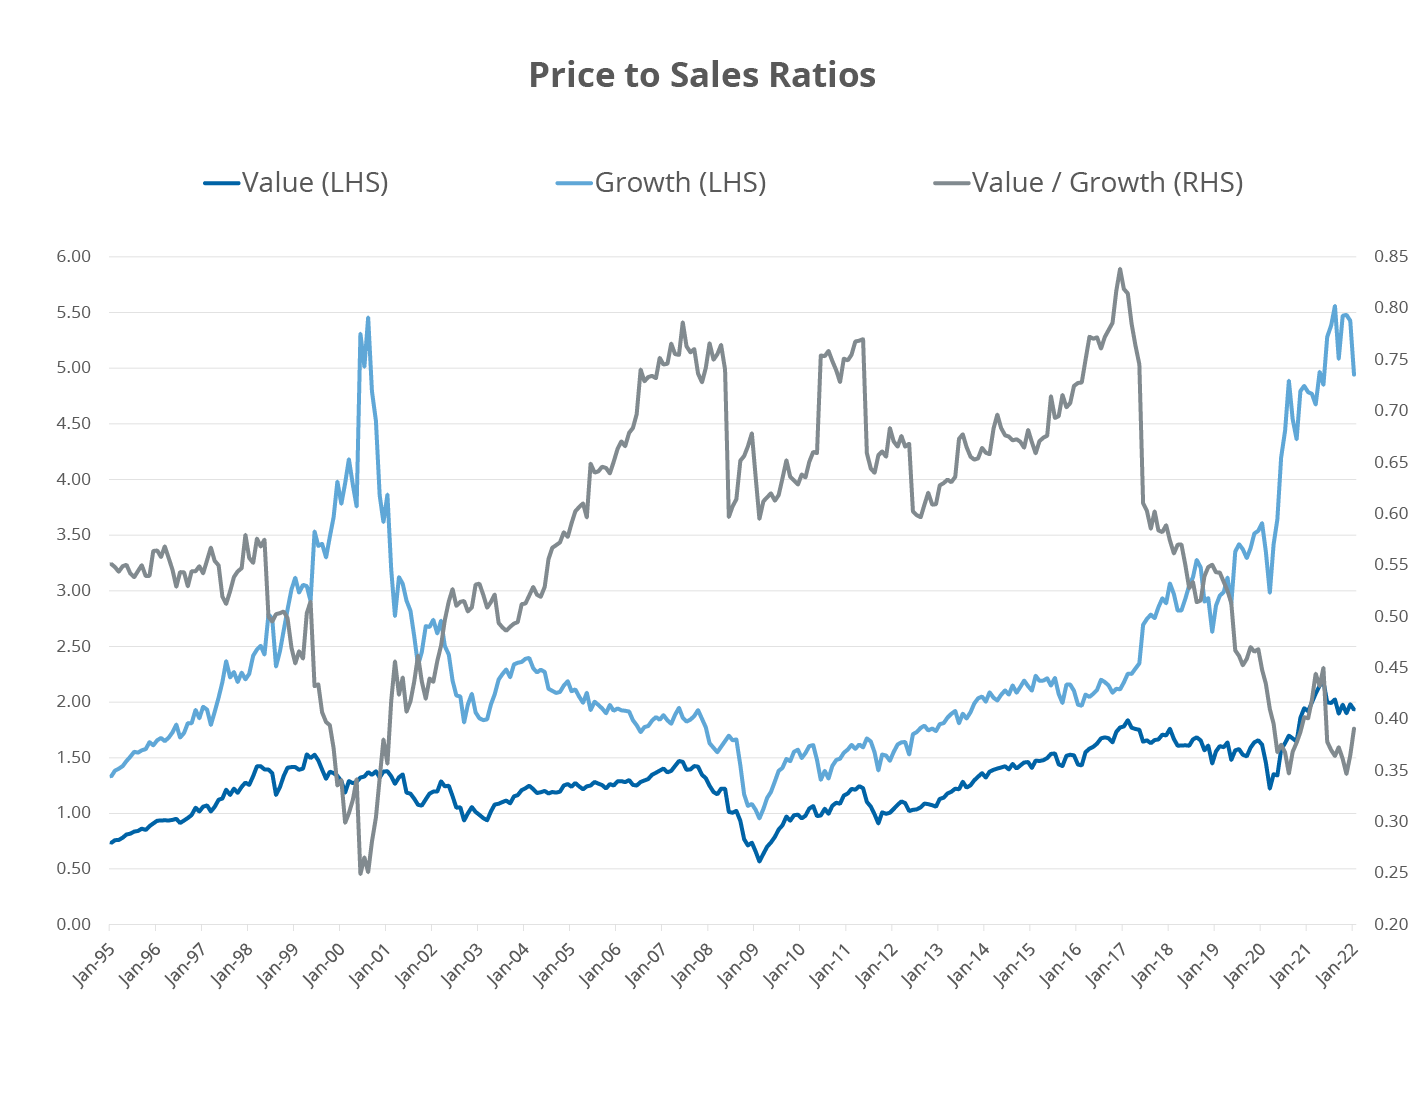
Bloomberg Finance, L.P., as of January 31, 2022. Growth represented by the Russell 1000 Growth Index and Value represented by the Russell 1000 Value Index.
Considering many mutual funds and growth ETFs focused on disruption tend to have higher expected growth rates, and trade at high valuation multiples, they have struggled as markets anticipate higher rates. Those primarily exposed to smaller, unprofitable companies have performed the worst, as evidenced by the S&P Kensho Moonshots Index underperforming the S&P 500 Index by close to 18% in 2022.
Thematic Exposures are Struggling Year-to-Date
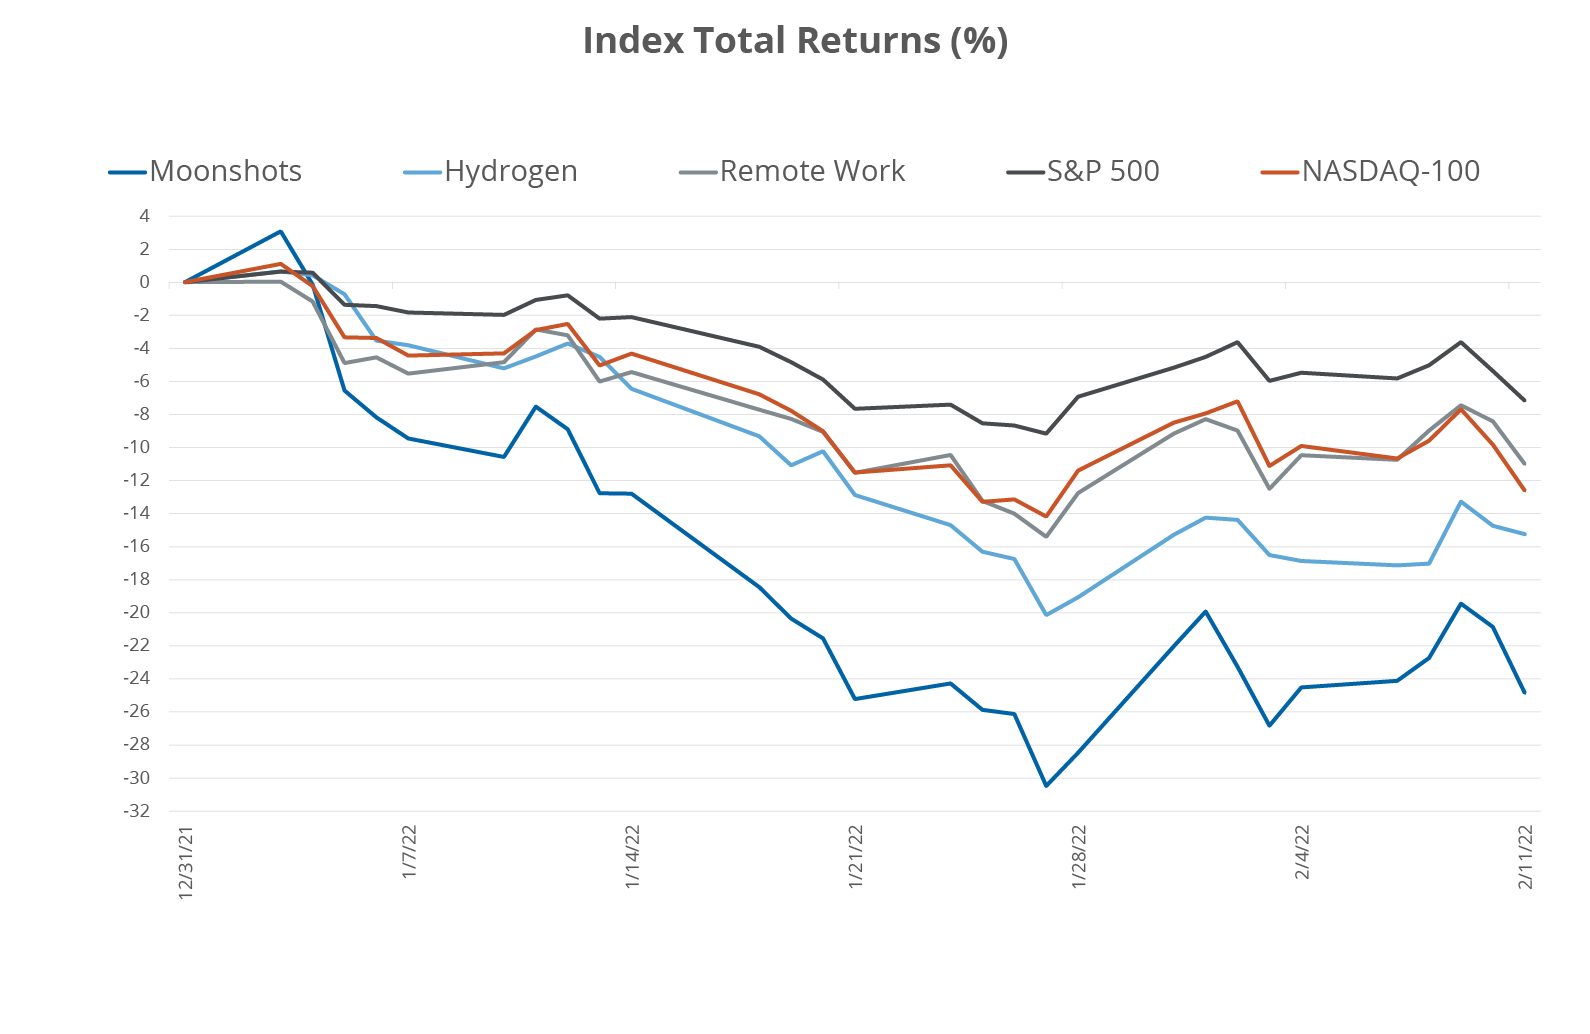
Source: Bloomberg Finance, L.P., as of February 11, 2022. Moonshots represented by the S&P Kensho Moonshots Index, Hydrogen represented by the Indxx Hydrogen Economy Index, and Remote Work represented by the Solactive Remote Work Index.
Recent Disruption May Be Good for Disruption
The near-term outlook for disruptive technology stocks remains uncertain thanks to a precarious geopolitical environment, continued questions on the path and pace of interest rate hikes, and generally mixed investor sentiment. However, the longer-term picture for disruptive stocks has improved thanks to valuations no longer being as rich, and nothing fundamentally changing regarding the potential for new technologies to change how the world works. In short, the proof will be in the pudding. If these companies can continue to grow at rapid rates, the market will reward them.
To learn more about the disruptive, thematic growth-oriented ETFs discussed in this article, visit:
- Direxion website: www.direxion.com
- MOON ETF page: https://www.direxion.com/product/moonshot-innovators-etf
- HJEN ETF page: https://www.direxion.com/product/hydrogen-etf
- WFH ETF page: https://www.direxion.com/product/direxion-work-from-home-etf
- Full list of Strategic & Thematic ETFs: https://www.direxion.com/etfs?filter=strategic_thematic
Definitions:
Price to Sales Ratio: An indicator of the value that financial markets have placed on each dollar of a company’s sales or revenues. The P/S ratio is calculated by dividing the stock price by the underlying company's sales per share.
Russell 1000 Growth Index: A market capitalization-weighted index based on the Russell 3000 Index. The Index's broad exposure to different sectors means it generally doesn't see large fluctuations often associated with growth stocks.
Russell 1000 Value Index: A market-capitalization weighted equity index based on the Russell 3000 Index. Value stocks trade at generally lower prices relative to fundamentals, and tend to pay higher dividends, making them attractive to value investors.
S&P 500® Index: Standard & Poor’s ® selects the stocks comprising the S&P 500 ® Index on the basis of market capitalization, financial viability of the company and the public float, liquidity and price of a company’s shares outstanding. The Index is a float-adjusted, market capitalization-weighted index. One cannot directly invest in an index.
Nasdaq-100® Index: The Index includes 100 of the largest domestic and international non-financial companies listed on the NASDAQ Stock Market ® based on market capitalization. All companies listed on the index have an average daily trading volume of at least 200,000 shares. One cannot directly invest in an index.
Indxx Hydrogen Economy Index: Tracks the performance of companies that provide goods and/or services related to the Hydrogen Industry, including hydrogen generation and storage, fuel cells, hydrogen stations, and hydrogen-based vehicles. The Index includes domestic securities as well as securities listed on various foreign markets, including among others, Japan and South Korea. The Index is reconstituted annually and rebalanced quarterly. One cannot directly invest in an index.
Solactive Remote Work Index: Comprised of U.S. listed securities and American Depository Receipts (“ADRs”) of companies that provide products and services in at least one of the following business segments that facilitate the ability of people to work from home: remote communications, cyber security, online project and document management, and cloud computing technologies (“WFH Industries”). The Index consists of 40 companies, namely, the top 10 ranked companies in each of the four WFH Industries. The Index is equal weighted at each semi-annual reconstitution and rebalance date. One cannot directly invest in an index.
S&P Kensho Moonshots Index: Is a product of S&P Dow Jones Indices LLC (“SPDJI”), and has been licensed for use by Rafferty Asset Management, LLC (“Rafferty”). Standard & Poor’s® and S&P® are registered trademarks of Standard & Poor’s Financial Services LLC (“S&P”); Dow Jones® is a registered trademark of Dow Jones Trademark Holdings LLC (“Dow Jones”); and these trademarks have been licensed for use by SPDJI and sublicensed for certain purposes by Rafferty. Rafferty’s ETFs are not sponsored, endorsed, sold or promoted by SPDJI, Dow Jones, S&P, their respective affiliates and none of such parties make any representation regarding the advisability of investing in such product(s) nor do they have any liability for any errors, omissions, or interruptions of the S&P Kensho Moonshots Index.