[1] Source: Morningstar, as of March 31, 2021.
[2] Moonshot companies defined as the S&P Kensho Moonshots Index.
[3] Source: Bloomberg Finance, L.P., as of March 31, 2001. Broad market defined as the Russell 3000 Index.
With a 29% return over the first 29 days of 2021, moonshot companies[1] outperformed a range of major indexes. The Russell 2000 Index’s strong performance received considerable media attention, but the S&P Kensho Moonshots Index outperformed it by over 16%. Moonshots beat the NASDAQ Next Generation 100 Index, which focuses on the next generation of NASDAQ-listed non-financial companies, by a whopping 26%. It also best the S&P 500 Index and NASDAQ-100 Indexes by considerable margins.
The Direxion Moonshot Innovators ETF (MOON) provides exposure to an index which attempts to target 50 of the most innovative, early-stage US-listed companies, by identifying those pursuing innovation with the potential to disrupt their existing industries in future. Unlike many thematic ETFs, MOON tilts heavily toward small caps, as they represent 69% of the fund according to Morningstar data, as the fund purposely targets companies at the emergence of their radical pursuits and products.[2] Small cap growth comprises 36% of the portfolio, making it the largest style by far. This is not to say large caps are not innovative, but their potential for further unique disruption may be limited compared to smaller, more nimble firms.
WHILE VOLATILE, MOONSHOTS OUTPERFORMED IN Q1, 2021.
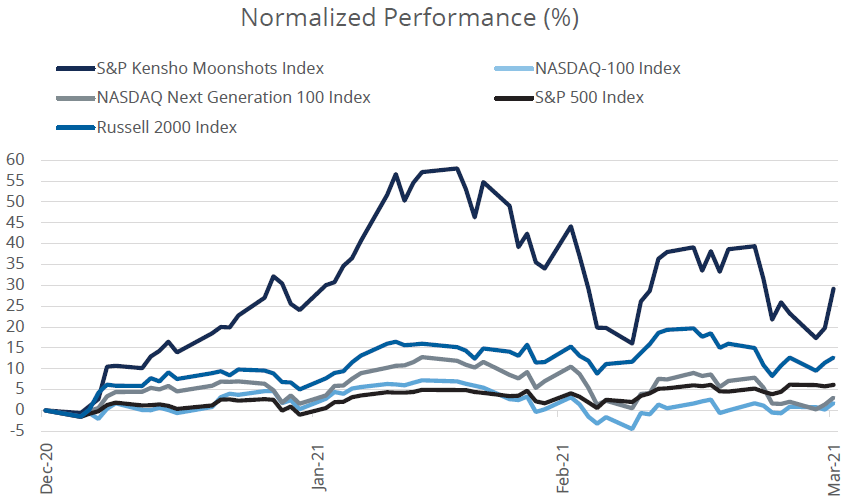 Source: Bloomberg Finance, L.P., as of March 31, 2021. This data represents past performance and is not indicative of future results. Short-term performance may often reflect conditions that are likely not sustainable and may not be repeated in the future. You cannot invest directly in an index.
Why Did Moonshots Do So Well?
In the first quarter, 32 stocks had positive performance, returning 45% on average, while 18 stocks underperformed, returning -15% on average. Two stocks returned over 200% and another two returned over 100%. The best performing stock was MicroVision, Inc. (NASDAQ: MVIS), a company that develops miniature laser sensing and projected display products, with use cases across consumer electronics, the automotive industry, and even healthcare. The stock was bolstered by news its technologies could be ready for market in 2021 and rumors it may be a takeout candidate from larger technology or consumer companies.
On the flipside, Tenable Holdings, Inc. (TENB), which provides cybersecurity solutions, fell over 30% in the quarter. The stock rose considerably in price, but fell sharply along with broader volatility in smaller technology names with long durations.
A DIVERSE GROUP OF STOCKS LEAD TO OUTPERFORMANCE
| Name | Thematic Sub-Sector | Average Weight (%) | Performance (%) | Contribution (%) |
| Top Contributors | ||||
| MicroVision, Inc. (MVIS) | Virtual Reality | 6.93 | 244.8 | 8.18 |
| Vuzix Corporation (VUZI) | Wearables | 5.72 | 180.18 | 6.16 |
| The ExOne Company (XONE) | 3D Printing | 3.89 | 230.45 | 3.60 |
| Vir Biotechnology, Inc. (VIR) | Genetic Engineering | 2.71 | 91.45 | 1.64 |
| ImmunityBio, Inc. (IBRX) | Genetic Engineering | 3.74 | 78.09 | 1.62 |
| Top Detractors | ||||
| Bluebird Bio, Inc. (BLUE) | Genetic Engineering | 1.42 | -30.32 | -0.34 |
| Oneconnect Financial Technology Co., Ltd. (OCFT) | Distributed Ledger | 1.45 | -25.01 | -0.35 |
| Mercury Systems, Inc. (MRCY) | Drones | 1.41 | -19.77 | -0.40 |
| MongoDB, Inc. (MDB) | Software & Services | 1.96 | -25.52 | -0.57 |
| Tenable Holdings, Inc. (TENB) | Cyber Security | 1.93 | -30.76 | -0.70 |
Source: Bloomberg Finance, L.P., January 1, 2021 to March 31, 2021.
Where Do Moonshots Go From Here?
While past performance is not indicative of future results, investors should be aware that with positive, but generally uncorrelated performance, returns may be volatile. The S&P Kensho Moonshots Index did experience a drawdown in March, as small cap stocks, and companies that carry substantial “duration” in their cash flows (e.g. growth stocks), suffered notably relative to the broader market.
MOONSHOTS REMAIN IN A DRAWDOWN FROM ALL-TIME HIGHS
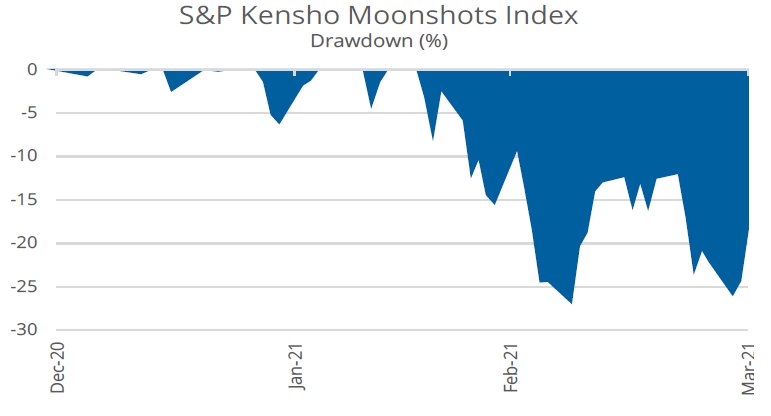
Source: Bloomberg Finance, L.P., as of March 31, 2021
Active share offers a measure of how differentiated a portfolio of securities is relative to a benchmark in an easy to understand manner. An active share of zero indicates a portfolio is identical to a given benchmark, while an active share of 100 indicates it is completely unique. Relative to the broad market, as measured by the Russell 3000 Index, MOON’s active share is 99.62, implying it is almost entirely differentiated from the broader US equity market.[3]
Going forward, investors should focus on understanding the potential opportunity for disruption MOON’s holdings offer. For example, companies involved with genetic engineering comprise over 18% of the fund, with cyber security and wearables each over 10%. The fund has exposure to fifteen other disruptive themes at the forefront of changing the world.
MOON TOP 10 HOLDINGS
| Name | Thematic Sub-Sector | GICS Sub-Industry | Market Cap | Weight |
| MicroVision, Inc. (MVIS) | Virtual Reality | Electronic Equipment & Instruments | Mid Cap | 10.86% |
| Vuzix Corporation (VUZI) | Wearables | Consumer Electronics | Small Cap | 9.37% |
| The ExOne Company (XONE) | 3D Printing | Industrial Machinery | Small Cap | 4.11% |
| ImmunityBio, Inc. (IBRX) | Genetic Engineering | Biotechnology | Mid Cap | 3.56% |
| FuelCell Energy, Inc. (FCEL) | Clean Technology | Electrical Components & Equipment | Mid Cap | 2.72% |
| Vir Biotechnology, Inc. (VIR) | Genetic Engineering | Biotechnology | Mid Cap | 2.68% |
| iRobot Corporation (IRBT) | Robotics | Household Appliances | Mid Cap | 2.45% |
| Xunlei Ltd. (XNET) | Distributed Ledger | Application Software | Small Cap | 2.43% |
| Glu Mobile Inc. (GLUU) | Digital Communities | Interactive Home Entertainment | Mid Cap | 2.10% |
| Plug Power, Inc. (PLUG) | Clean Technology | Electrical Components & Equipment | Large Cap | 2.06% |
Source: Bloomberg Finance, L.P., as of March 31, 2021.
MOON THEMATIC SUB-SECTORS BY WEIGHT
| Thematic Sub-Sectors | Weight |
| Genetic Engineering | 17.59% |
| Cyber Security | 13.14% |
| Virtual Reality | 10.86% |
| Wearables | 10.48% |
| Clean Technology | 8.21% |
| 3D Printing | 6.09% |
| Digital Communities | 5.86% |
| Drones | 4.38% |
| Distributed Ledger | 3.54% |
| Autonomous Vehicles | 3.48% |
| Robotics | 3.44% |
| Enterprise Collaboration | 3.32% |
| Advanced Transport Systems | 2.05% |
| Smart Buildings | 1.79% |
| Internet Services & Infrastructure | 1.73% |
| Software & Services | 1.47% |
| Space | 1.47% |
| Smart Grids | 1.10% |
Source: Bloomberg Finance, L.P., as of March 31, 2021. Subject to change.
MOON STANDARDIZED PERFORMANCE (as of 3/31/2021)
| 1M% | 3M% | YTD% | 1Y% | S/I% | Inception Date | Expense Ratio* (Gross/Net) | |
| NAV | -3.64 | 29.26 | 29.26 | — | 64.00 | 11/12/2020 | 0.65 / 0.65* |
| Market Close | -3.55 | 29.25 | 29.25 | — | 64.20 | ||
| KMOON Index | -3.62 | 29.19 | 29.19 | — | 64.10 |
The performance data quoted represents past performance. Past performance does not guarantee future results. The investment return and principal value of an investment will fluctuate. An investor’s shares, when redeemed, may be worth more or less than their original cost. Current performance may be lower or higher than the performance quoted. Returns for performance under one year are cumulative, not annualized. For the most recent month-end performance, click here.
Short-term performance, in particular, is not a good indication of the fund’s future performance, and an investment should not be made based solely on returns. Because of ongoing market volatility, fund performance may be subject to substantial short-term changes. For additional information, see the fund’s prospectus.
An investor should carefully consider a Fund’s investment objective, risks, charges, and expenses before investing. A Fund’s prospectus and summary prospectus contain this and other information about the Direxion Shares. To obtain a Fund’s prospectus and summary prospectus call 866-476-7523 or visit our website at direxion.com. A Fund’s prospectus and summary prospectus should be read carefully before investing.
The “S&P Kensho Moonshots Index” is a product of S&P Dow Jones Indices LLC (“SPDJI”), and has been licensed for use by Rafferty Asset Management, LLC (“Rafferty”). Standard & Poor’s® and S&P® are registered trademarks of Standard & Poor’s Financial Services LLC (“S&P”); Dow Jones® is a registered trademark of Dow Jones Trademark Holdings LLC (“Dow Jones”); and these trademarks have been licensed for use by SPDJI and sublicensed for certain purposes by Rafferty. Rafferty’s ETFs are not sponsored, endorsed, sold or promoted by SPDJI, Dow Jones, S&P, their respective affiliates and none of such parties make any representation regarding the advisability of investing in such product(s) nor do they have any liability for any errors, omissions, or interruptions of the S&P Kensho Moonshots Index.
Direxion Shares ETF Risks - Investing involves risk including possible loss of principal. There is no guarantee the investment strategy will be successful. The value of stocks of information technology companies and companies that rely heavily on innovation and technology are particularly vulnerable to rapid changes in technology product cycles, rapid product obsolescence, government regulation and competition, both domestically and internationally, including competition from competitors with lower production costs. Innovative technology companies may struggle to capitalize on new technology or may face competition and obsolescence. Additional risks of the Fund include, but are not limited to, Index Correlation/Tracking Risk, Index Strategy Risk, Market Disruption Risk, and risks associated with the market capitalizations of the securities in which the Fund may invest. Please see the summary and full prospectuses for a more complete description of these and other risks of the Fund.
Distributor: Foreside Fund Services, LLC.