Investing in the Secular Remote Revolution.
The Direxion Work From Home ETF (NYSE: WFH) celebrated its first birthday on June 25, 2021. A year ago, some on the Twittersphere cited its launch as emblematic of the top for stocks associated with empowering remote work. Morningstar even went so far to name WFH one the worst new ETFs of 2020, as they considered it be a fad and overvalued based on their estimates of fair value.[1] We may be biased, but even after just one year, the critics seem to be wrong – no offense. Since inception on June 25, 2020, WFH has returned 51.3% / 51.2% (market price/net asset value), outperforming the S&P 500 Index by over 10%, and the NASDAQ-100 Index by over 8%, over the same period. This outperformance is notable considering the narrative around the economic reopening and the return-to-offices. What may be even more impressive, and potentially unbelievable to some investors or followers of the theme, is the fact the Work From Home ETF has outpaced both major indices by over 14% since the Pfizer vaccine announcement on November 9, 2020.
WFH Stocks Continue to Outperform[2]
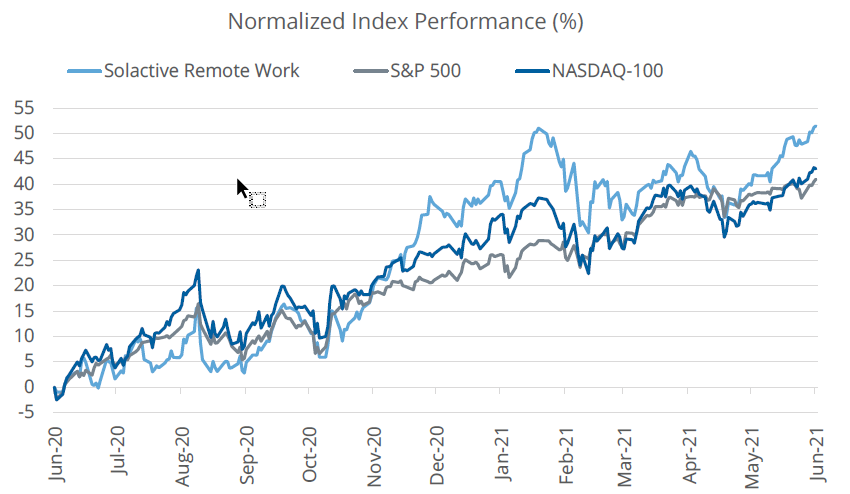
Source: Bloomberg Finance, L.P., as of June 25, 2021.
Let’s dive deeper into why performance has been so robust – first from a macro perspective.
Considering the progress the U.S. has made combatting the COVID-19 virus, the number of Americans working remotely has decreased after staying steady for much of the winter. This trend is counterintuitive to the longevity of the “work from home” theme - there is no doubt about it. That being said, the most recent 16.6% remains quite elevated compared to the evidence that suggests pre-pandemic levels of people working from home across the U.S. were in the low single-digits.
Evidence Suggests Remote Work is Sticky
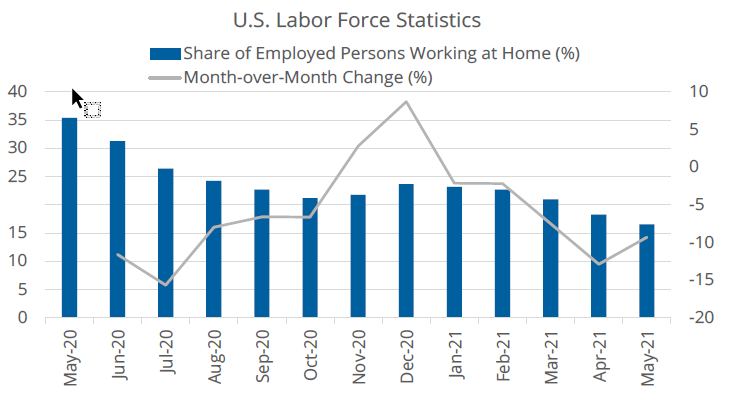
Source: U.S. Bureau of Labor Statistics, as of May 31, 2021.
Another way of looking at the trends of working from offices, or remotely, involves using alternative data. Kastle, a security firm, created a Back to Work Barometer that measures the share of workers swiping into offices in 10 metro areas in the U.S. The 4-week moving average sits at a 2021 high of 31.1%, up from 21.1% at the end of 2020.[3] This points to a positive trend, but a measured one as firms evaluate their future working models with hybrid solutions gaining momentum.
Return to Offices is Moderate in Major Metros[4]
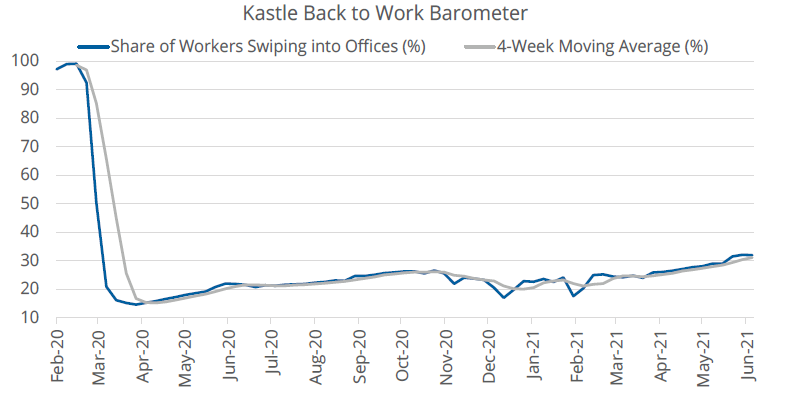
Source: Bloomberg Finance, L.P., as of June 23, 2021. Data represents the average of 10 metro areas in the US.
Companies large and small have and continue to support their employees working remotely, be that in their home offices or in other locations across the globe. Whether that support is in the form of deeper infrastructure buildouts, or increased spend on cyber and cloud solutions, firms across almost all sectors and industries are paying attention to the needs of their employees. The workplace has become a more digital one; the pandemic has accelerated this progress, and despite looming uncertainties that generally result in less confidence around investments, the numbers are clear: firms are focused on spending on the next phase of their workforce.
Follow the Money: IT Spending is Forecast to Increase Considerably
| 2020 Spending | 2020 Growth % | 2021 Spend | 2021 Growth % | |
| Enterprise Software | 466,647 | -2.1 | 516,872 | 10.8 |
| Devices | 663,223 | -6.9 | 755,798 | 14.0 |
| IT Services | 1,021,187 | -1.8 | 1,112,626 | 9.0 |
| Communications Services | 1,386,471 | -0.7 | 1,450,444 | 4.6 |
| Overall IT | 3,757,468 | -2.2 | 4,072,547 | 8.4 |
Source: Gartner, April 2021.
The increased spend (growth rates of which are up since the estimates from October 2020) across the board for software, devices, IT services, and communication platforms is emblematic of two things that we expect to power the next phase of growth for many of the companies in WFH. The first being the continued need to support employees both in the office and in disparate locations. The second is simply the fact that companies and business have continued to invest and prioritize the digitization of the workplace. This is a secular shift, not a cyclical one. The core drivers of this change are well represented by the four thematic pillars built within the Solactive Remote Work Index: cloud technology, cyber security, online project and document management, and remote communication.
At a more micro level, the stocks in the Solactive Remote Work Index, the target index for WFH, exhibits favorable growth characteristics relative to its valuation. While WFH trades at a premium multiple to the S&P 500, its constituents’ historical sales and estimated earnings are superior. In addition, the 40 stocks in WFH delivered less growth than the NASDAQ-100 on average over the last twelve months, and their price to sales and earnings are significantly less rich than the tech-heavy NASDAQ.
WFH Target Index Stocks Offer Strong Growth Prospects
| Solactive Remote Work Index | S&P 500 Index | NASDAQ-100 Index | |
| Price to Sales (x) | 3.71 | 3.11 | 5.56 |
| Price to Earnings (x) | 29.94 | 27.19 | 37.00 |
| 12-Month Historical Sales Growth (%) | 15.99 | 10.18 | 19.20 |
| Estimated EPS Growth (%) | 26.38 | 16.06 | 20.60 |
Source: Bloomberg Finance, L.P., as of June 25, 2021.
While the valuation spread for remote work stocks remains above historical averages, we believe the expected growth differential is extremely favorable. If this growth continues to materialize, investors paying up for higher multiples now may prove fruitful.
Simply put, returning to offices does not imply WFH will underperform. In fact, it may be the very opposite as this theme seeks to capture 40 stocks that are supporting the ability for firms and employees to be agnostic of location, but is also seeking the transformation that is taking place across companies towards a more digital age.
WFH Top 10 Holdings
| Name | Ticker | Remote Work Pillar | Market Cap ($, B) | Weight (%) |
| Proofpoint Inc | PFPT | Cyber Security | 9.98 | 3.32 |
| Fortinet Inc | FTNT | Cyber Security | 39.51 | 3.19 |
| Nutanix Inc | NTNX | Cloud Technologies | 8.24 | 3.09 |
| Box Inc | BOX | Online Project and Document Management | 4.10 | 3.05 |
| Facebook Inc | FB | Remote Communications | 961.31 | 3.01 |
| Adobe Inc | ADBE | Online Project and Document Management | 275.2 | 2.89 |
| NetApp Inc | NTAP | Cloud Technologies | 18.02 | 2.85 |
| DocuSign Inc | DOCU | Online Project and Document Management | 54.02 | 2.82 |
| Alphabet Inc | GOOGL | Online Project and Document Management | 1,671.99 | 2.74 |
| Crowdstrike Holdings Inc | CRWD | Cyber Security | 57.95 | 2.72 |
Source: Bloomberg Finance, L.P., as of June 25, 2021.
WFH Standardized Performance
| As of 6/30/2021 | 1M % | 3M % | YTD % | 1Y % | 3Y % | 5Y % | 10Y % | S/I | Inception Date | Expense Ratio* (Gross/Net %) |
| NAV | 6.45 | 10.99 | 12.39 | 49.71 | — | — | — | 51.92 | 6/25/2020 | 0.45 / 0.45* |
| Market Close | 6.61 | 11.09 | 12.39 | 49.62 | — | — | — | 52.06 |
The performance data quoted represents past performance and does not guarantee future results. The investment return and principal value of an investment will fluctuate. An investor’s shares, when redeemed, may be worth more or less than their original cost. Current performance may be lower or higher than the performance quoted. For performance data current to the most recent month end, please visit www.direxion.com/product/direxion-work-from-home-etf .
[1]https://www.morningstar.com/articles/1015624/the-best-and-worst-new-etfs-of-2020
[2]Source: Bloomberg Finance, L.P., as of June 25, 2021.
[3]Source: U.S. Bureau of Labor Statistics, as of May 31, 2021.
[4]Source: Bloomberg Finance, L.P., as of June 23, 2021. Data represents the average of 10 metro areas in the US.
An investor should carefully consider a Fund’s investment objective, risks, charges, and expenses before investing. A Fund’s prospectus and summary prospectus contain this and other information about the Direxion Shares. To obtain a Fund’s prospectus and summary prospectus call 866-301-9214 or visit our website at direxion.com. A Fund’s prospectus and summary prospectus should be read carefully before investing.
Solactive AG is not a sponsor of, or in any way affiliated with, the Direxion Work From Home ETF, or the Direxion Connected Consumer ETF
Shares of the Direxion Shares are bought and sold at market price (not NAV) and are not individually redeemed from a Fund. Market Price returns are based upon the midpoint of the bid/ask spread at 4:00 pm EST (when NAV is normally calculated) and do not represent the returns you would receive if you traded shares at other times. Brokerage commissions will reduce returns. Fund returns assume that dividends and capital gains distributions have been reinvested in the Fund at NAV. Some performance results reflect expense reimbursements or recoupments and fee waivers in effect during certain periods shown. Absent these reimbursements or recoupments and fee waivers, results would have been less favorable.
Direxion Shares ETF Risks – Investing involves risk including possible loss of principal. There is no guarantee the investment strategy will be successful. The value of stocks of information technology companies and companies that rely heavily on technology is particularly vulnerable to rapid changes in technology product cycles, rapid product obsolescence, government regulation and competition, both domestically and internationally, including competition from competitors with lower production costs. ADRs are issued by non-U.S. companies and are subject to various foreign investment risks including but not limited to the risk that the currency in the issuing company’s country will drop relative to the U.S. dollar, that politics or regime changes in the issuing company’s country will undermine exchange rates or destabilize the company and its earnings. Additional risks of the Fund include, but are not limited to, Index Correlation/Tracking Risk, Index Strategy Risk, Market Disruption Risk, American Depositary Receipts Risk and risks associated with the market capitalizations of the securities in which the Fund may invest. Please see the summary and full prospectuses for a more complete description of these and other risks of the Fund.
Distributor: Foreside Fund Services, LLC.