Financial Stocks: Fight or Flight?

Editor's note: Any and all references to time frames longer than one trading day are for purposes of market context only, and not recommendations of any holding time frame. Daily rebalancing ETFs are not meant to be held unmonitored for long periods. If you don't have the resources, time or inclination to constantly monitor and manage your positions, leveraged and inverse ETFs are not for you.
In many ways, the financial sector represents the foundation of the global economy. After all, the sector’s product is literally money, which means it is especially sensitive to modifications in monetary policy. The sector weathered the 2022 equity storm better than some of its peers, but the big macroeconomic concerns in the near-term surround the possibility of a recession, and whether inflation has peaked.
The Persistent Inflation Bull Case
Recent economic data has emboldened the notion that inflation has peaked, although it’s important to keep in mind that these data points are generally laggard in nature. A simple rebound in commodity prices could serve to reignite higher inflation expectations, which in turn, could help lead to another rise in interest rates.
For financials, higher interest rates can mean higher profits simply from spreads*. In other words, commercial banks borrow from the Fed at a lower rate, and then lend to customers at a higher rate. When rates rise, spreads increase, which translates to potentially higher profits for financial institutions. Traders looking to bet on higher bank earnings going forward may consider opportunities in Direxion’s Daily Financial Bull 3X Shares (Ticker: FAS), which seeks daily investment results, before fees and expenses, of 300%, of the performance of the Financial Select Sector Index*. Below is a daily chart of FAS as of January 19, 2023.
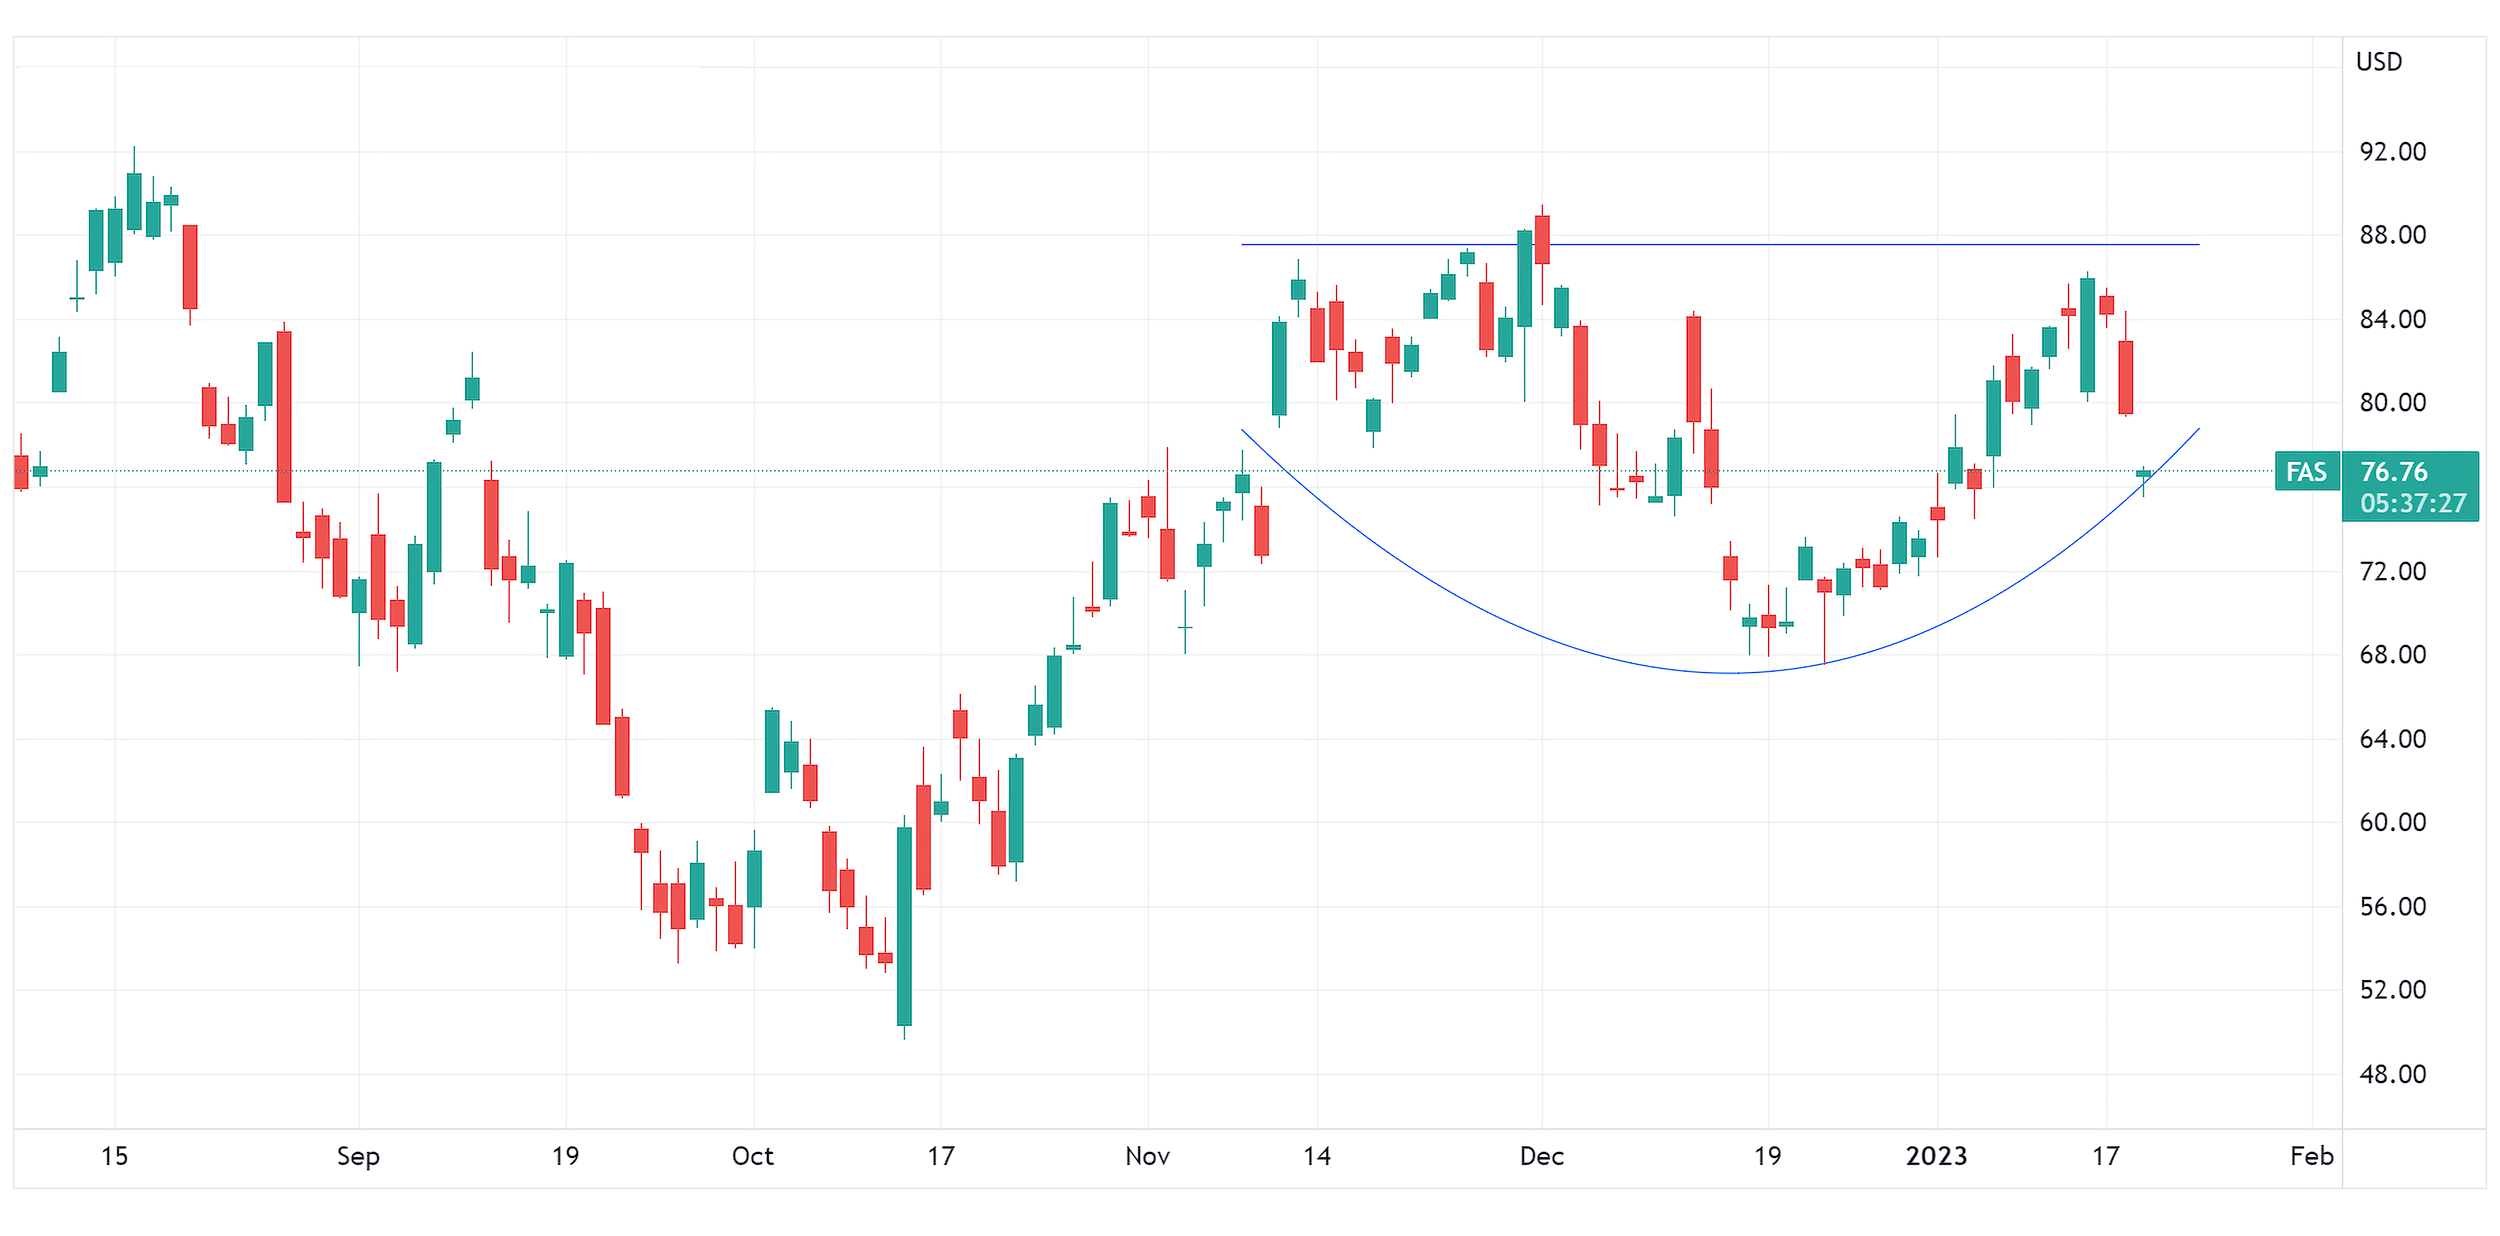
Source: TradingView.com
Candlestick charts display the high and low (the stick) and the open and close price (the body) of a security for a specific period. If the body is filled, it means the close was lower than the open. If the body is empty, it means the close was higher than the open.
The performance data quoted represents past performance. Past performance does not guarantee future results. The investment return and principal value of an investment will fluctuate. An investor’s shares, when redeemed, may be worth more or less than their original cost; current performance may be lower or higher than the performance quoted. For the most recent month-end performance go to Direxion.com/etfs. For standardized performance click here.
The Recession Bear Case
The notion that higher rates are unequivocally beneficial to financials requires a bit more nuance, especially when demand is considered. Higher rates mean higher interest expenses, and at some point, will deter borrowers due to higher costs and is likely to stifle demand. We’re already starting to see signs of this from the latest round of bank earnings, which have been lackluster in some cases. Additionally, if the economy falls into a recession, a widespread drop in demand will reduce the number of borrowers, which could hurt the bottom line for financials.
Traders keen on the bearish case for financials may find opportunities with Direxion’s Daily Financial Bear 3X Shares (Ticker: FAZ), which seeks daily investment results, before fees and expenses, of 300% of the inverse (opposite), of the performance of the Financial Select Sector Index.
The top-holdings in this fund as of December 31, 2022, include Warren Buffet’s Berkshire Hathaway (Ticker: BRK/A)(14.85%), JP Morgan (Ticker: JPM) (10.50%), and Bank of America (Ticker: BAC) (6.17%)*. JP Morgan recently reported its Q4 earnings and did better than its peers by exceeding estimates. Q4 results produced an earnings-per-share (EPS)* of $3.57, which was above expectations of $3.11. Bank of America’s Q4 results produced an EPS of $0.85, beating estimates of $0.76. BRK/A is slated to report its Q4 earnings around February 26, and estimates are for an EPS of $5,352.
* Holdings are subject to change and risk. For the fund’s top holdings and other important information, please click here.
But overall, the sector’s earnings guidance wasn’t so optimistic, especially with respect to net-interest income*. If BRK/A misses on its Q4 estimates, it could be a bearish catalyst for financials.
Below is a daily chart of FAZ as of January 19, 2023.
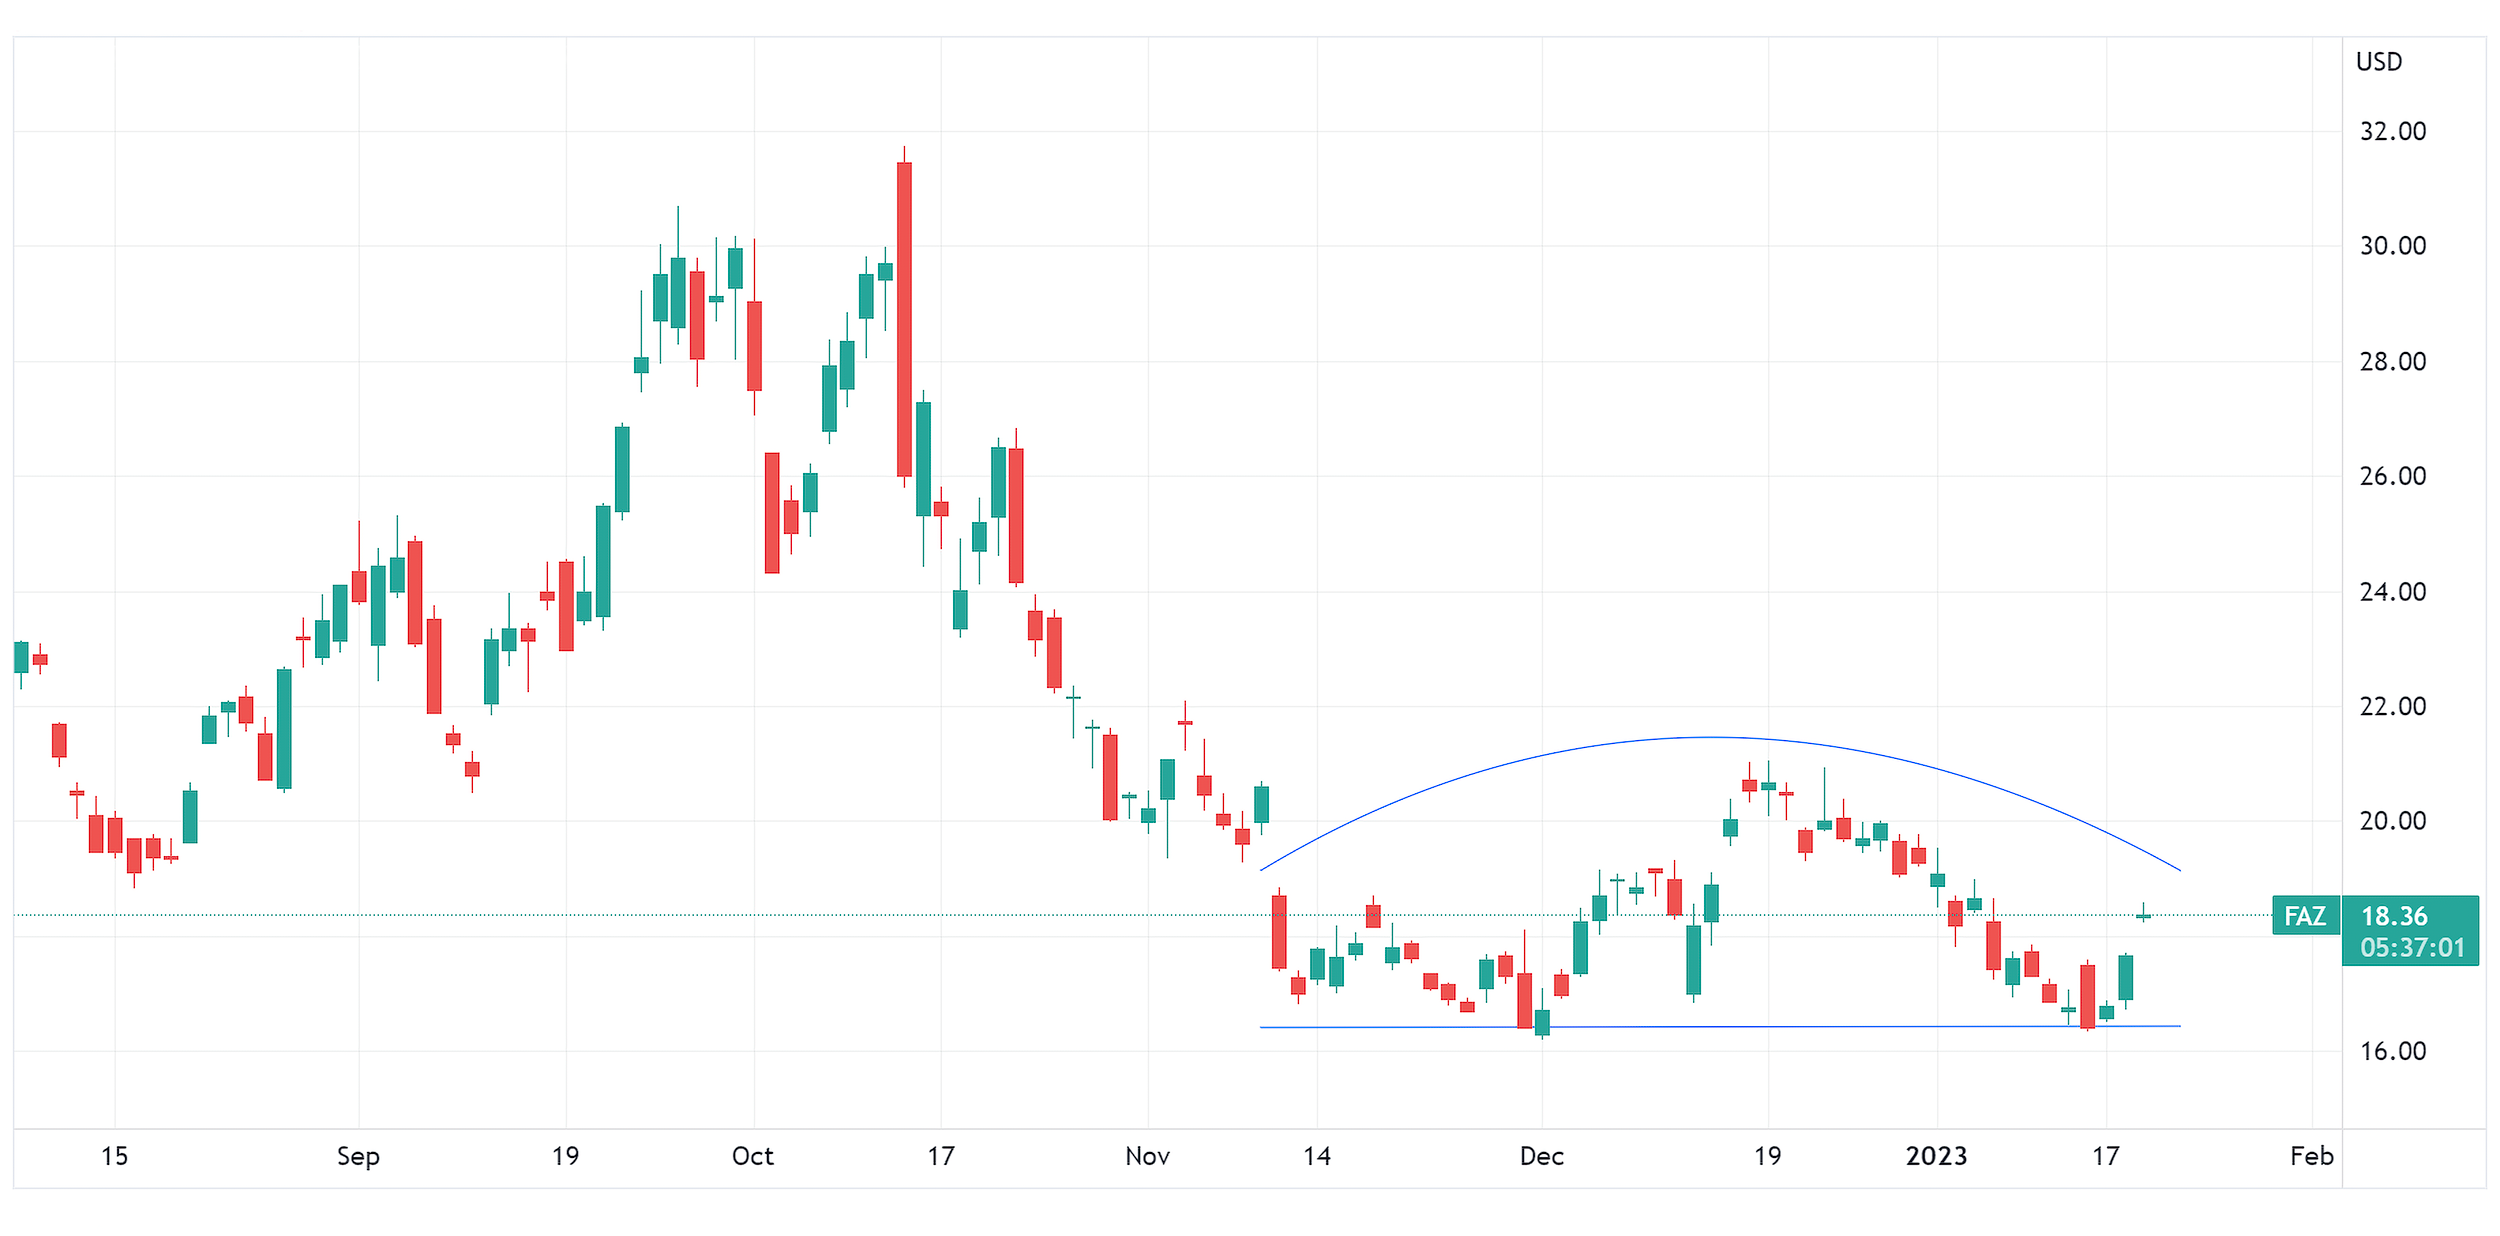
Source: TradingView.com
Candlestick charts display the high and low (the stick) and the open and close price (the body) of a security for a specific period. If the body is filled, it means the close was lower than the open. If the body is empty, it means the close was higher than the open.
The performance data quoted represents past performance. Past performance does not guarantee future results. The investment return and principal value of an investment will fluctuate. An investor’s shares, when redeemed, may be worth more or less than their original cost; current performance may be lower or higher than the performance quoted. For the most recent month-end performance go to Direxion.com/etfs. For standardized performance click here.
Additional Means to Speculate in Financials
Traders seeking a more niche play in financials may consider opportunities in Direxion’s Daily Regional Banks Bull 3X Shares (Ticker: DPST), which seeks daily investment results, before fees and expenses, of 300% of the performance of the S&P Regional Banks Select Industry Index*.
*Definitions:
Spread - The spread refers to the difference or hap that exists between two prices, rates, or yields.
The Financial Select Sector Index is provided by S&P Dow Jones Indices and includes securities of companies from the following industries: Banks; Thrifts & Mortgage Finance; Diversified Financial Services; Consumer Finance; Capital Markets; Insurance; and Mortgage Real Estate Investment Trusts (REITs).
Earnings-Per-Share (EPS) - Earnings per share (EPS) is a company's net profit divided by the number of common shares it has outstanding.
Net-Interest Income - Net interest income (NII) is the difference between revenues generated by interest-bearing assets and the cost of servicing (interest-burdened) liabilities
The S&P Regional Banks Select Industry Index (SPSIRBKT) is a modified equal-weighted index that is designed to measure performance of the stocks comprising the S&P Total Market Index that are classified in the Global Industry Classification Standard (GICS) regional banks sub-industry.
An investor should carefully consider a Fund’s investment objective, risks, charges, and expenses before investing. A Fund’s prospectus and summary prospectus contain this and other information about the Direxion Shares. To obtain a Fund’s prospectus and summary prospectus call 866-476-7523 or visit our website at www.direxion.com. A Fund’s prospectus and summary prospectus should be read carefully before investing.
Leveraged and Inverse ETFs pursue daily leveraged investment objectives which means they are riskier than alternatives which do not use leverage. They seek daily goals and should not be expected to track the underlying index over periods longer than one day. They are not suitable for all investors and should be utilized only by sophisticated investors who understand leverage risk and who actively manage their investments.
Direxion Shares Risks – An investment in each Fund involves risk, including the possible loss of principal. Each Fund is non-diversified and includes risks associated with the Funds’ concentrating their investments in a particular industry, sector, or geographic region which can result in increased volatility. The use of derivatives such as futures contracts and swaps are subject to market risks that may cause their price to fluctuate over time. Risks of each Fund include Effects of Compounding and Market Volatility Risk, Leverage Risk, Market Risk, Counterparty Risk, Rebalancing Risk, Intra-Day Investment Risk, Other Investment Companies (including ETFs) Risk, and risks specific to the securities of the Financial Sector. Performance of companies in the financials sector may be materially impacted by many factors, including but not limited to, government regulations, economic conditions, credit rating downgrades, changes in interest rates and decreased liquidity in credit markets.
Additional risks include, for the Direxion Daily Financial Bull 3X Shares, Daily Index Correlation Risk, and for the Direxion Daily Financial Bear 3X Shares, Daily Inverse Index Correlation Risk, and risks related to Shorting and Cash Transactions. Please see the summary and full prospectuses for a more complete description of these and other risks of each Fund.
It is not possible to invest directly in an index.
Distributor: Foreside Fund Services, LLC.