Is Energy Pointing to Economic Woes on the Horizon?

Editor's note: Any and all references to time frames longer than one trading day are for purposes of market context only, and not recommendations of any holding time frame. Daily rebalancing ETFs are not meant to be held unmonitored for long periods. If you don't have the resources, time or inclination to constantly monitor and manage your positions, leveraged and inverse ETFs are not for you.
The energy sector’s woes have continued as of late in conjunction with the broader slowdown in inflationary pressures. Back when inflation* was running rampant in the economy, the energy sector offered traders one of the few speculative opportunities on the long side of the market. But with its continued struggles, is the sector flashing a bigger warning signal for the overall economy?
Are Recession Risks Priced In?
The energy sector is key with respect to gauging economic demand. When the economy is growing, there is greater demand for energy, as it is a necessity for virtually all forms of activity. When the economy begins to contract, it’s often reflected in the energy markets, and leads to lower prices due to less demand.
Despite the encouraging economic data as of late, the recent price action in energy could be warning of a potential recession on the horizon. Weakness in the energy markets could continue in this scenario and provide an opportunity for traders to profit off bearish bets.
Direxion’s Daily Energy Bear 2X Shares (Ticker: ERY), which seeks daily investment results, before fees and expenses, of 200% of the inverse (or opposite) of the performance of the Energy Select Sector Index* could see a nice bid in this situation.
Below is a daily chart of ERY as of January 18, 2024.
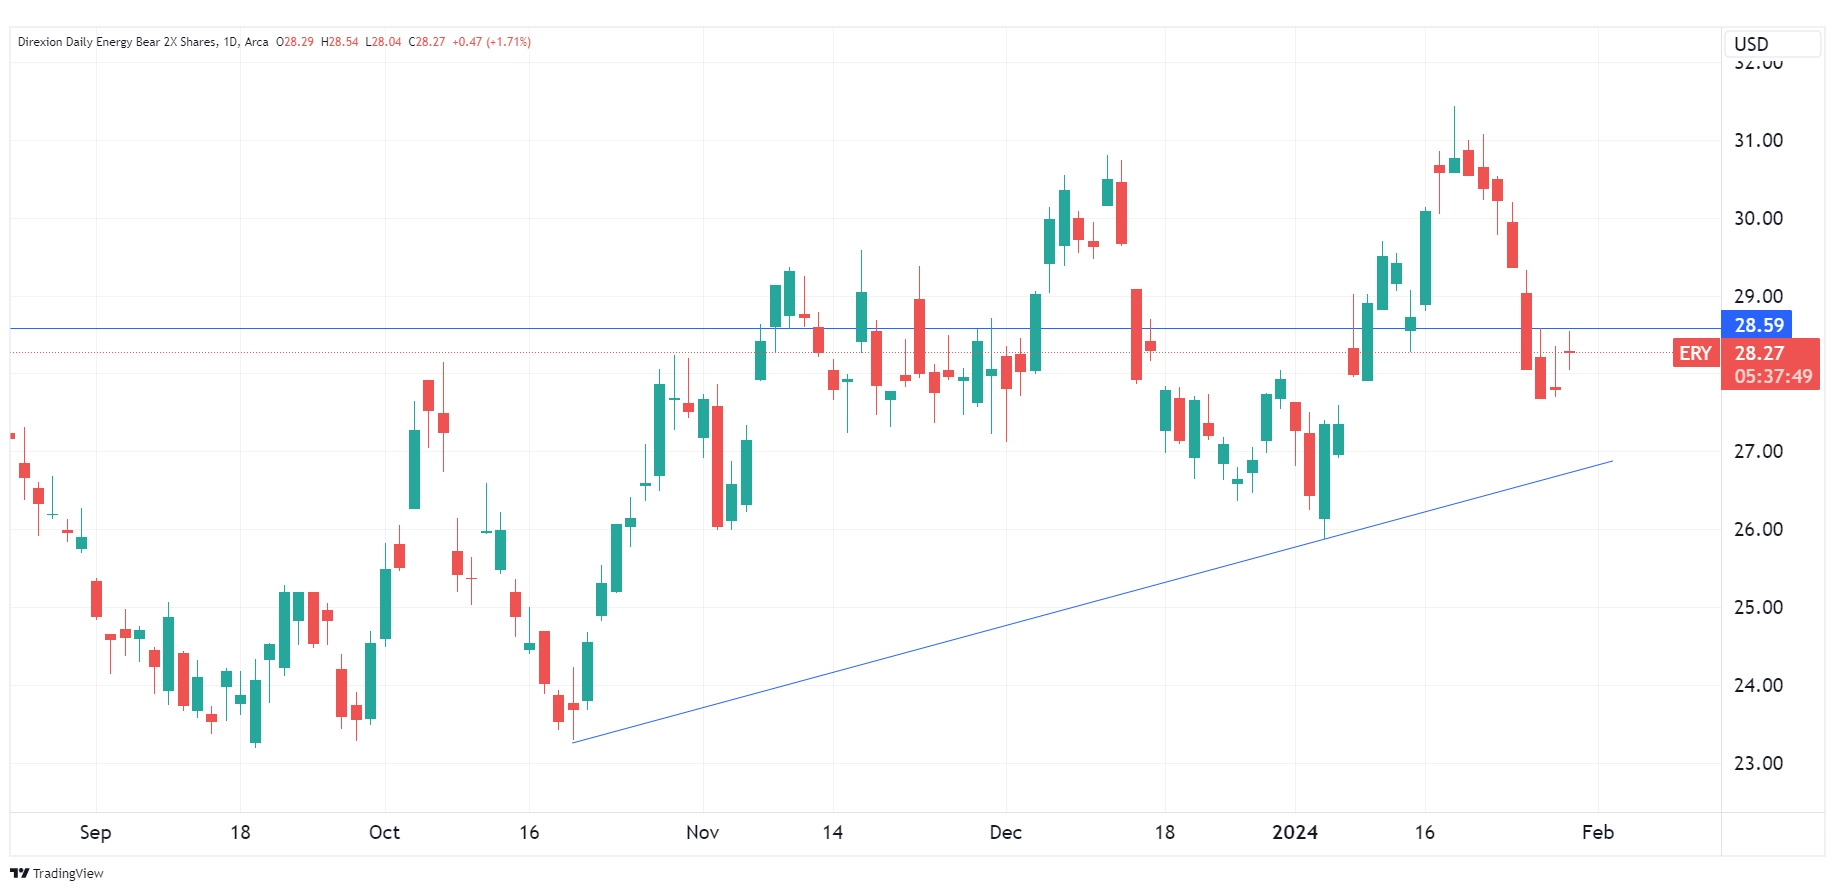
Source: TradingView.com
Candlestick charts display the high and low (the stick) and the open and close price (the body) of a security for a specific period. If the body is filled, it means the close was lower than the open. If the body is empty, it means the close was higher than the open.
The performance data quoted represents past performance. Past performance does not guarantee future results. The investment return and principal value of an investment will fluctuate. An investor’s shares, when redeemed, may be worth more or less than their original cost; current performance may be lower or higher than the performance quoted. For the most recent month-end performance go to Direxion.com/etfs. For standardized performance click here.
The slanted blue line represents an uptrend. An uptrend describes the price movement of a financial asset when the overall direction is upward.
What if Rate Cuts Lead to More Inflation?
Traders also need to grapple with the likelihood of upcoming rate cuts from the Federal Reserve. In theory, a return to expansionary monetary policy could reignite inflationary pressures that have become dormant for the last several months. This could help to reignite the downtrodden energy sector.
Traders that think a return to accommodative monetary policy could help the energy space may find a trade with Direxion’s Daily Energy Bull 2X Shares (Ticker: ERX), which seeks daily investment results, before fees and expenses, of 200% of the performance of the Energy Select Sector Index.
We are also in Q4 2023 earnings season now. The top stocks in Direxion’s ERX and ERY funds include Exxon Mobil Corporation (Ticker: XOM), Chevron Corp (Ticker: CVX), and ConocoPhillips (Ticker: COP).
Traders would be wise to watch for the upcoming earnings results in these companies. An upside surprise or positive guidance could lead to a pop in those stocks and could benefit ERY. Both XOM and CVX will report their earnings on February 2, while COP’s earnings date is February 8.
To view the fund’s full holdings, click here. Holdings are subject to risk and change.
Below is a daily chart of ERX as of January 18, 2024.
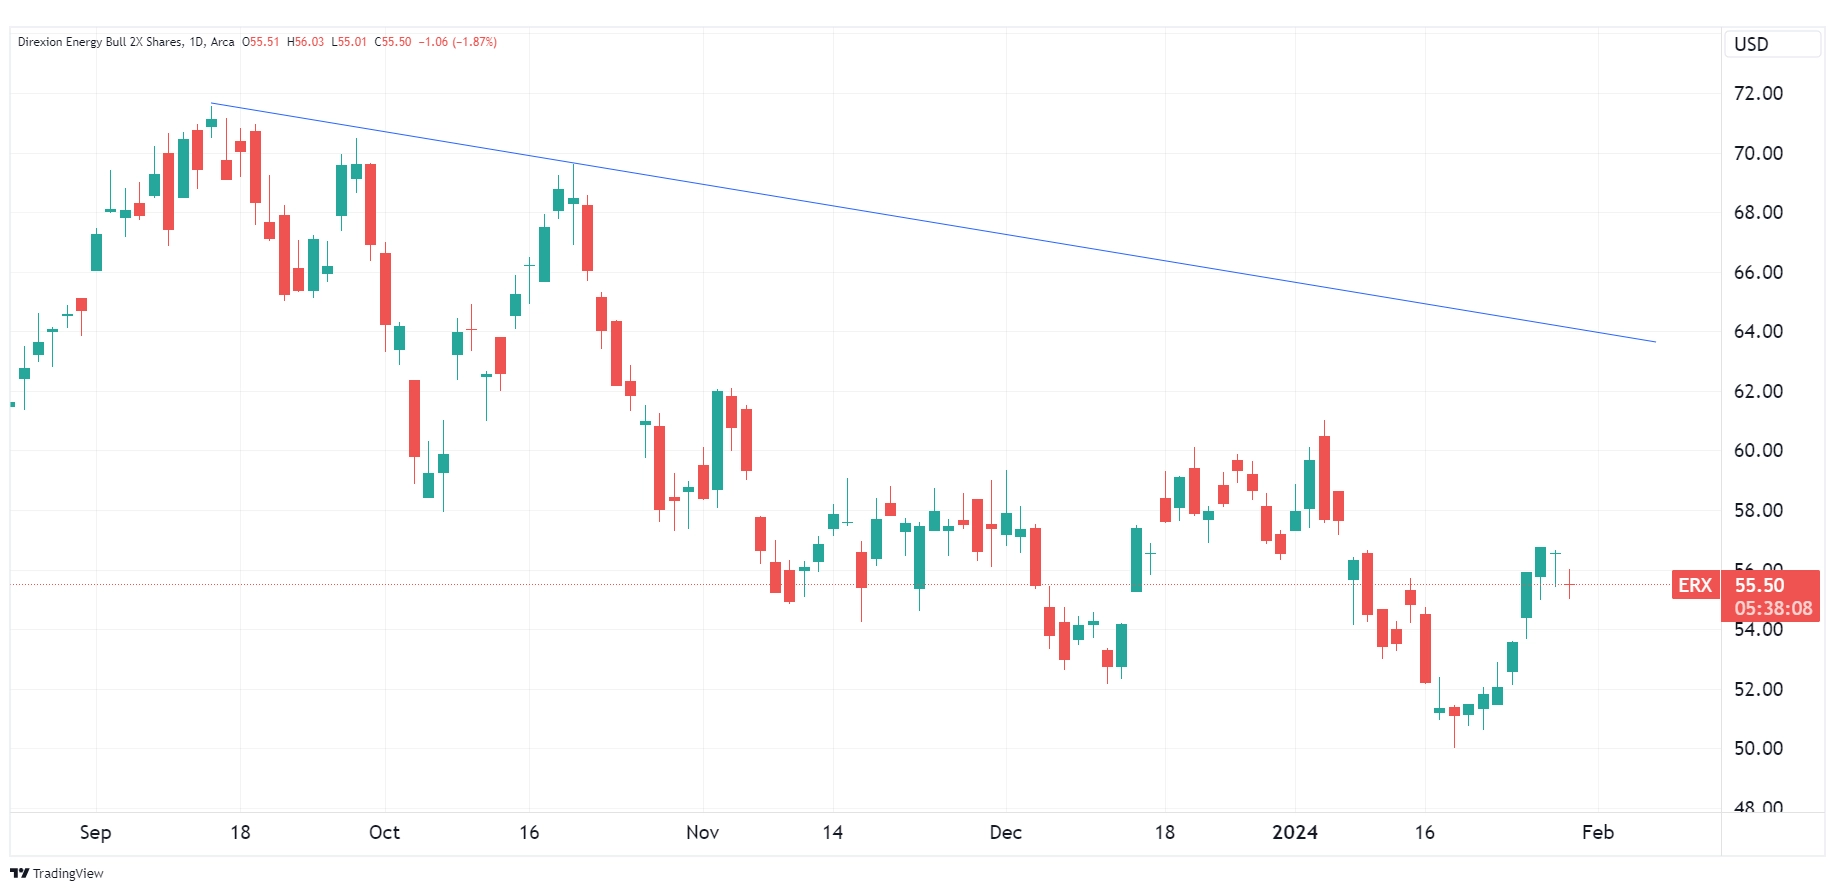
Source: TradingView.com
Candlestick charts display the high and low (the stick) and the open and close price (the body) of a security for a specific period. If the body is filled, it means the close was lower than the open. If the body is empty, it means the close was higher than the open.
The performance data quoted represents past performance. Past performance does not guarantee future results. The investment return and principal value of an investment will fluctuate. An investor’s shares, when redeemed, may be worth more or less than their original cost; current performance may be lower or higher than the performance quoted. For the most recent month-end performance go to Direxion.com/etfs. For standardized performance click here.
The slanted blue line represents a downtrend. A downtrend describes the price movement of a financial asset when the overall direction is downward.
More Equity Plays
Traders looking for additional opportunities within the energy sector may consider the Direxion Daily S&P Oil & Gas Exp. & Prod. Bull 2X Shares (Ticker: GUSH) or the Direxion Daily S&P Oil & Gas Exp. & Prod. Bear 2X Shares (Ticker: DRIP), which track, before fees and expenses, 200%, or -200%, respectively, of the performance of the S&P Oil & Gas Exploration & Production Select Industry Index*. There’s also a Direxion Daily Global Clean Energy Bull 2X Shares (Ticker: KLNE), which tracks daily investment results, before fees and expenses, of 200% of the performance of the S&P Global Clean Energy Index* for those looking to trade in the alternative energy space.
*Definitions and Index Descriptions
An investor should carefully consider a Fund’s investment objective, risks, charges, and expenses before investing. A Fund’s prospectus and summary prospectus contain this and other information about the Direxion Shares. To obtain a Fund’s prospectus and summary prospectus call 866-476-7523 or visit our website at direxion.com. A Fund’s prospectus and summary prospectus should be read carefully before investing.
The Energy Select Sector Index (IXETR) is provided by S&P Dow Jones Indices and includes domestic companies from the energy sector which includes the following industries: oil, gas and consumable fuels; and energy equipment and services.
The S&P Oil & Gas Exploration & Production Select Industry Index (SPSIOPTR) is provided by S&P Dow Jones Indices, LLC and includes domestic companies from the oil and gas exploration and production sub-industry. The Index is a modified equal-weighted index that is designed to measure the performance of a sub-industry or group of sub-industries determined based on the Global Industry Classification Standards (GICS).
The S&P Global Clean Energy Index (SPGTCLNT) is designed to track the performance of companies from developed and emerging markets whose economic fortunes are tied to the global clean energy business. The Index is limited to those stocks traded on an exchange that meet or exceed, at the time of inclusion, $300 million in total market capitalization, $100 million in float-adjusted market capitalization, and $3 million average daily value traded over a six-month period. The Index is rebalanced semiannually.
One cannot invest in an index.
The "Energy Select Sector Index" is a product of S&P Dow Jones Indices LLC ("SPDJI"), and has been licensed for use by Rafferty Asset Management, LLC ("Rafferty"). Standard & Poor’s® and S&P® are registered trademarks of Standard & Poor’s Financial Services LLC ("S&P"); Dow Jones® is a registered trademark of Dow Jones Trademark Holdings LLC ("Dow Jones"); and these trademarks have been licensed for use by SPDJI and sublicensed for certain purposes by Rafferty. Rafferty’s ETFs are not sponsored, endorsed, sold or promoted by SPDJI, Dow Jones, S&P, their respective affiliates and none of such parties make any representation regarding the advisability of investing in such product(s) nor do they have any liability for any errors, omissions, or interruptions of the Energy Select Sector Index.
These funds track a commodity related equity index, consisting of a basket of energy related stocks. They do not invest in physical commodities and should not be expected to directly track the performance of energy related commodities.
Direxion Shares Risks – An investment in each Fund involves risk, including the possible loss of principal. Each Fund is non-diversified and includes risks associated with the Funds’ concentrating their investments in a particular industry, sector, or geographic region which can result in increased volatility. The use of derivatives such as futures contracts and swaps are subject to market risks that may cause their price to fluctuate over time. Risks of each Fund include Effects of Compounding and Market Volatility Risk, Leverage Risk, Market Risk, Counterparty Risk, Rebalancing Risk, Intra-Day Investment Risk, Other Investment Companies (including ETFs) Risk, Cash Transaction Risk, Tax Risk, and risks specific to investment in the securities of the Energy Sector. Companies that engage in energy-related businesses and companies primarily involved in the production and mining of coal, development and production of oil, gas and consumable fuels and provide drilling and other energy resources production and distribution related services are subject to risks of legislative or regulatory changes, adverse market conditions and/or increased competition affecting the energy sector. Additional risks include, for the Direxion Daily Energy Bull 2X Shares, Daily Index Correlation Risk, and for the Direxion Daily Energy Bear 2X Shares, Daily Inverse Index Correlation Risk, and risks related to Shorting. Please see the summary and full prospectuses for a more complete description of these and other risks of each Fund.
Distributor: Foreside Fund Services, LLC.