SOXL, SOXS, AI & Chips – Can the Craze Continue?
Editor's note: Any and all references to time frames longer than one trading day are for purposes of market context only, and not recommendations of any holding time frame. Daily rebalancing ETFs are not meant to be held unmonitored for long periods. If you don't have the resources, time or inclination to constantly monitor and manage your positions, leveraged and inverse ETFs are not for you.
In light of the boom in artificial intelligence (AI), there’s been a tremendous surge in demand for computer chips to accommodate this new technology. As a result, there’s been a tremendous bid in the semiconductor sector, in addition to notable revenue and earnings growth. But can this trend be sustained, or has the sector gone beyond the mania phase?
A Match Made in Artificial Heaven?
Many of the “monsters of tech” have dived deep into developing artificial intelligence technologies and moved to incorporate them into their businesses. A prime example is Amazon.com, Inc. with their Amazon Web Services.
A report recently surfaced that Amazon is collaborating with NVIDIA Corporation to produce Trainium2, which is a chip for training artificial intelligence models. Amazon will also be offering access to Nvidia’s H200 Tensor Core graphics processing units. This is but one example of the growth in artificial intelligence unfolding in conjunction with demand for semiconductors.
Traders that find themselves in alignment with the bullish case in semiconductors may find an opportunity with Direxion’s Daily Semiconductor Bull 3X Shares (Ticker: SOXL), which seeks daily investment results, before fees and expenses, of 300% of the performance of the NYSE Semiconductor Index*.
Below is a daily chart of SOXL as of November 30, 2023.
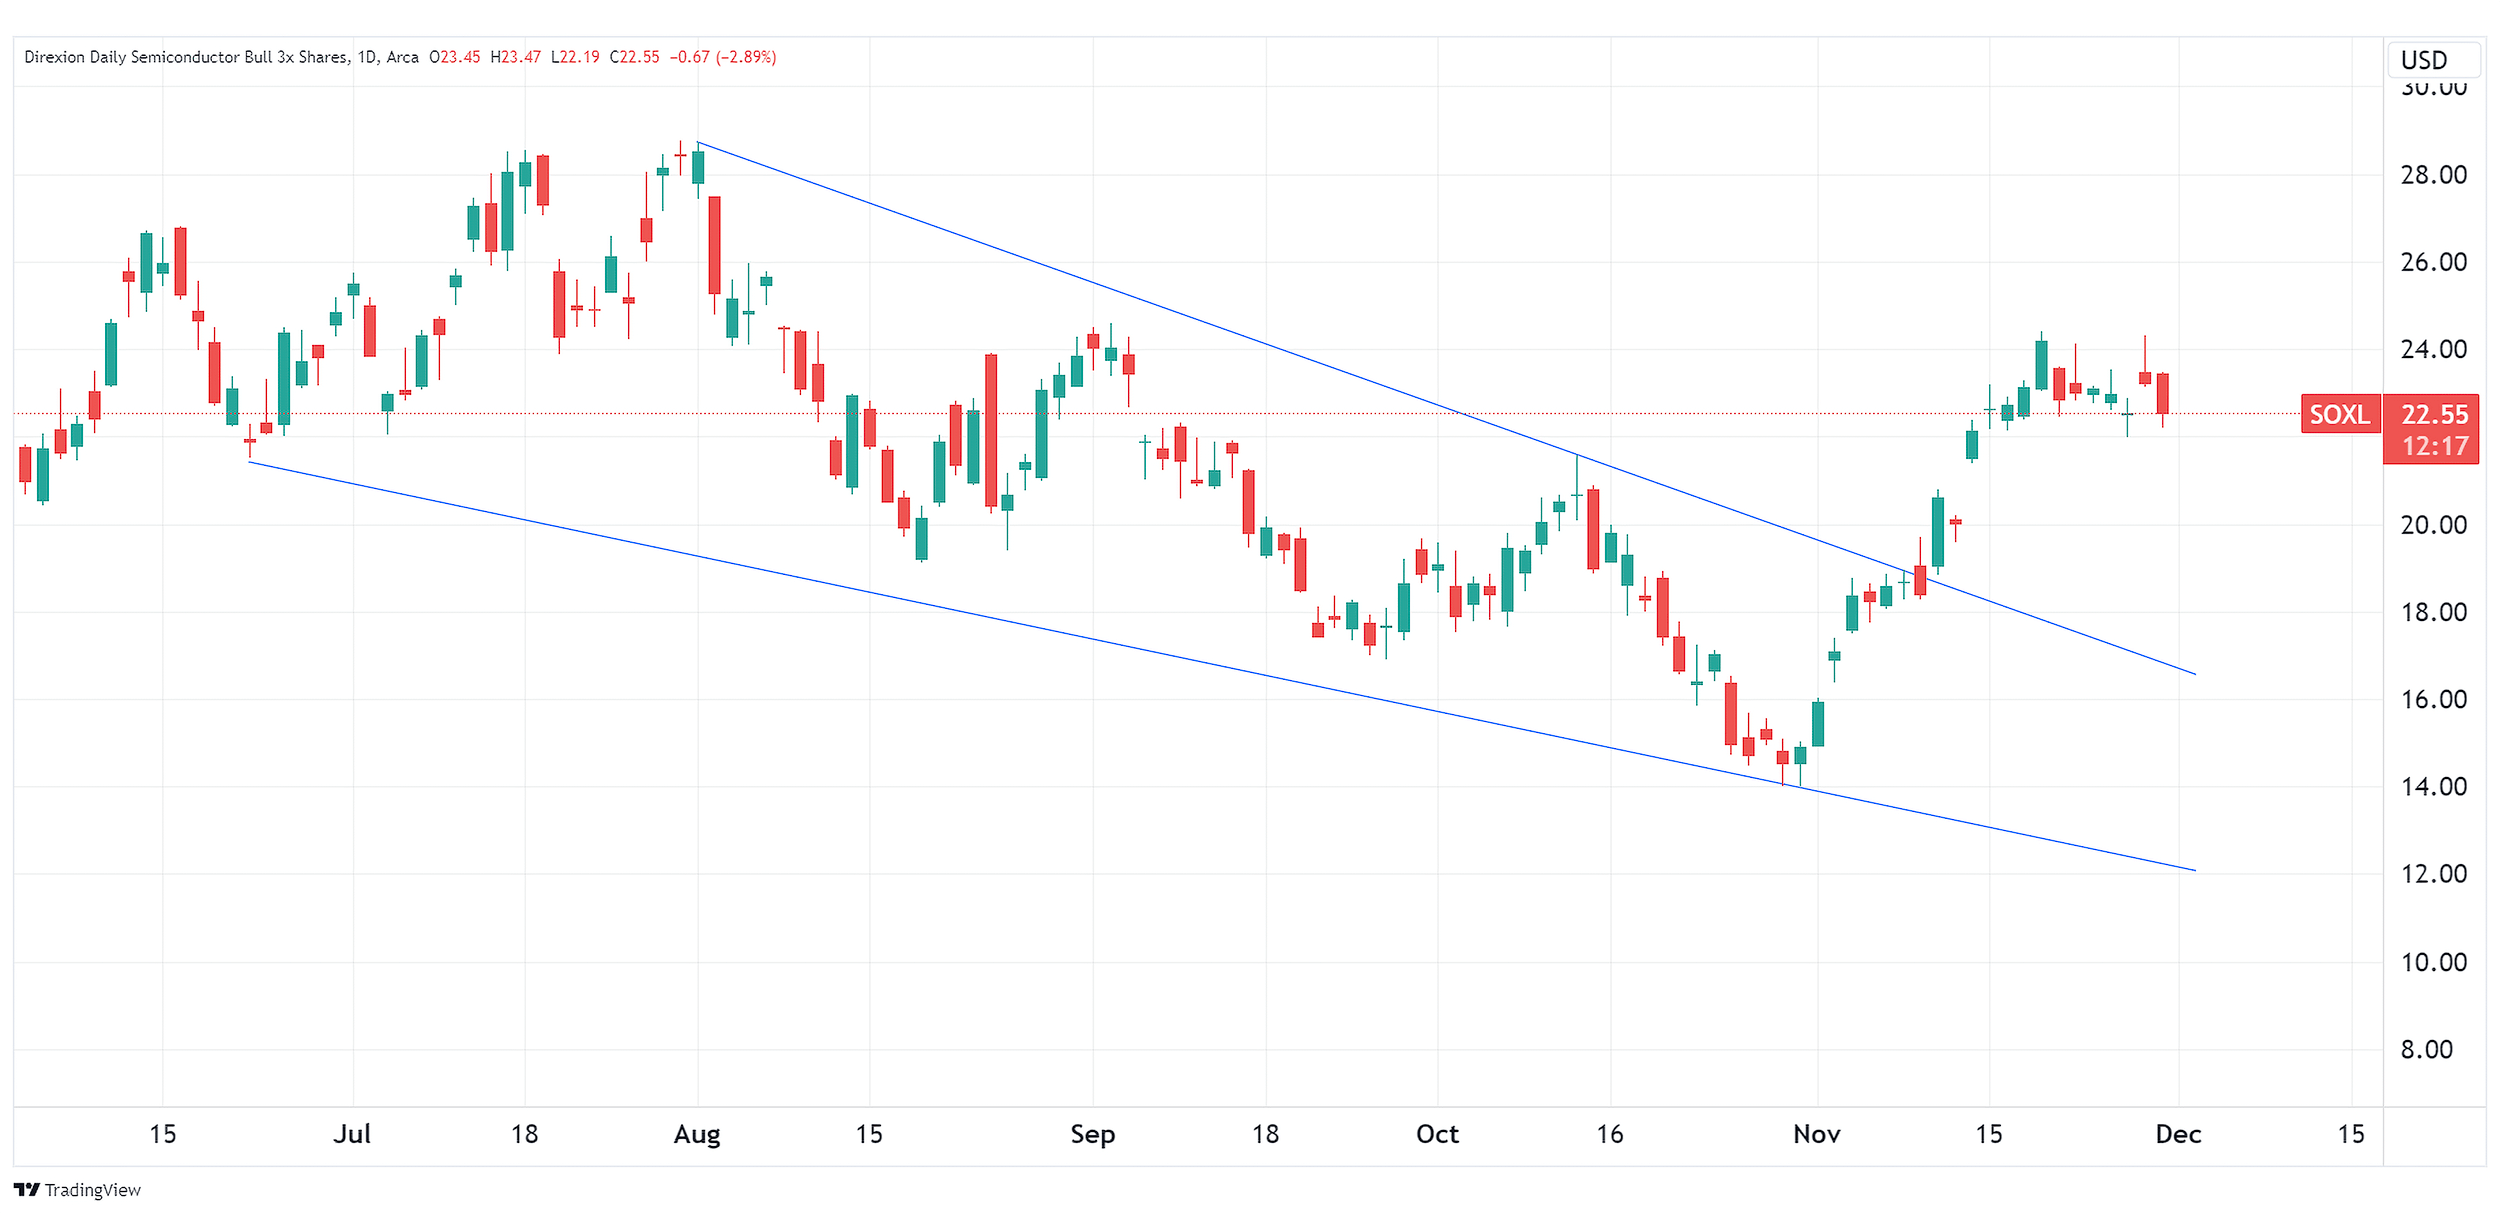
Source: TradingView.com
Candlestick charts display the high and low (the stick) and the open and close price (the body) of a security for a specific period. If the body is filled, it means the close was lower than the open. If the body is empty, it means the close was higher than the open.
The performance data quoted represents past performance. Past performance does not guarantee future results. The investment return and principal value of an investment will fluctuate. An investor’s shares, when redeemed, may be worth more or less than their original cost; current performance may be lower or higher than the performance quoted. For the most recent month-end performance go to Direxion.com/etfs. For standardized performance click here.
Could an Earnings Slowdown Damper Sentiment?
Markets are coming off another earnings season, and once again, cumulative results generally surpassed expectations. However, the economy has been in expansion mode for years, and some Fed watchers are calling for the central bank to start easing on monetary policy as early as Q2 2024. Could this be an initial sign of an economic slowdown?
Traders that think an economic slowdown could potentially lead to a decrease in chip demand may find a position with Direxion’s Daily Semiconductor Bear 3X Shares (Ticker: SOXS), which seeks daily investment results, before fees and expenses of 300% of the inverse (or opposite), of the performance of the NYSE Semiconductor Index*.
The top holdings in this Index include Advanced Micro Devices (Ticker: AMD), Broadcom Limited (Ticker: AVGO), and Nvidia (Ticker: NVDA). The next earnings report for AMD is on January 29, 2024, whereas AVGO is set to report on December 6, 2023. An earnings miss, or even a lower forward guidance, could be a catalyst for a pullback in SOXS. NVDA recently reported its earnings results on November 20, which exceeded analyst estimates.
Click here to see each fund’s full holdings. Holdings are subject to risk and change.
Below is a daily chart of SOXS as of November 30, 2023.
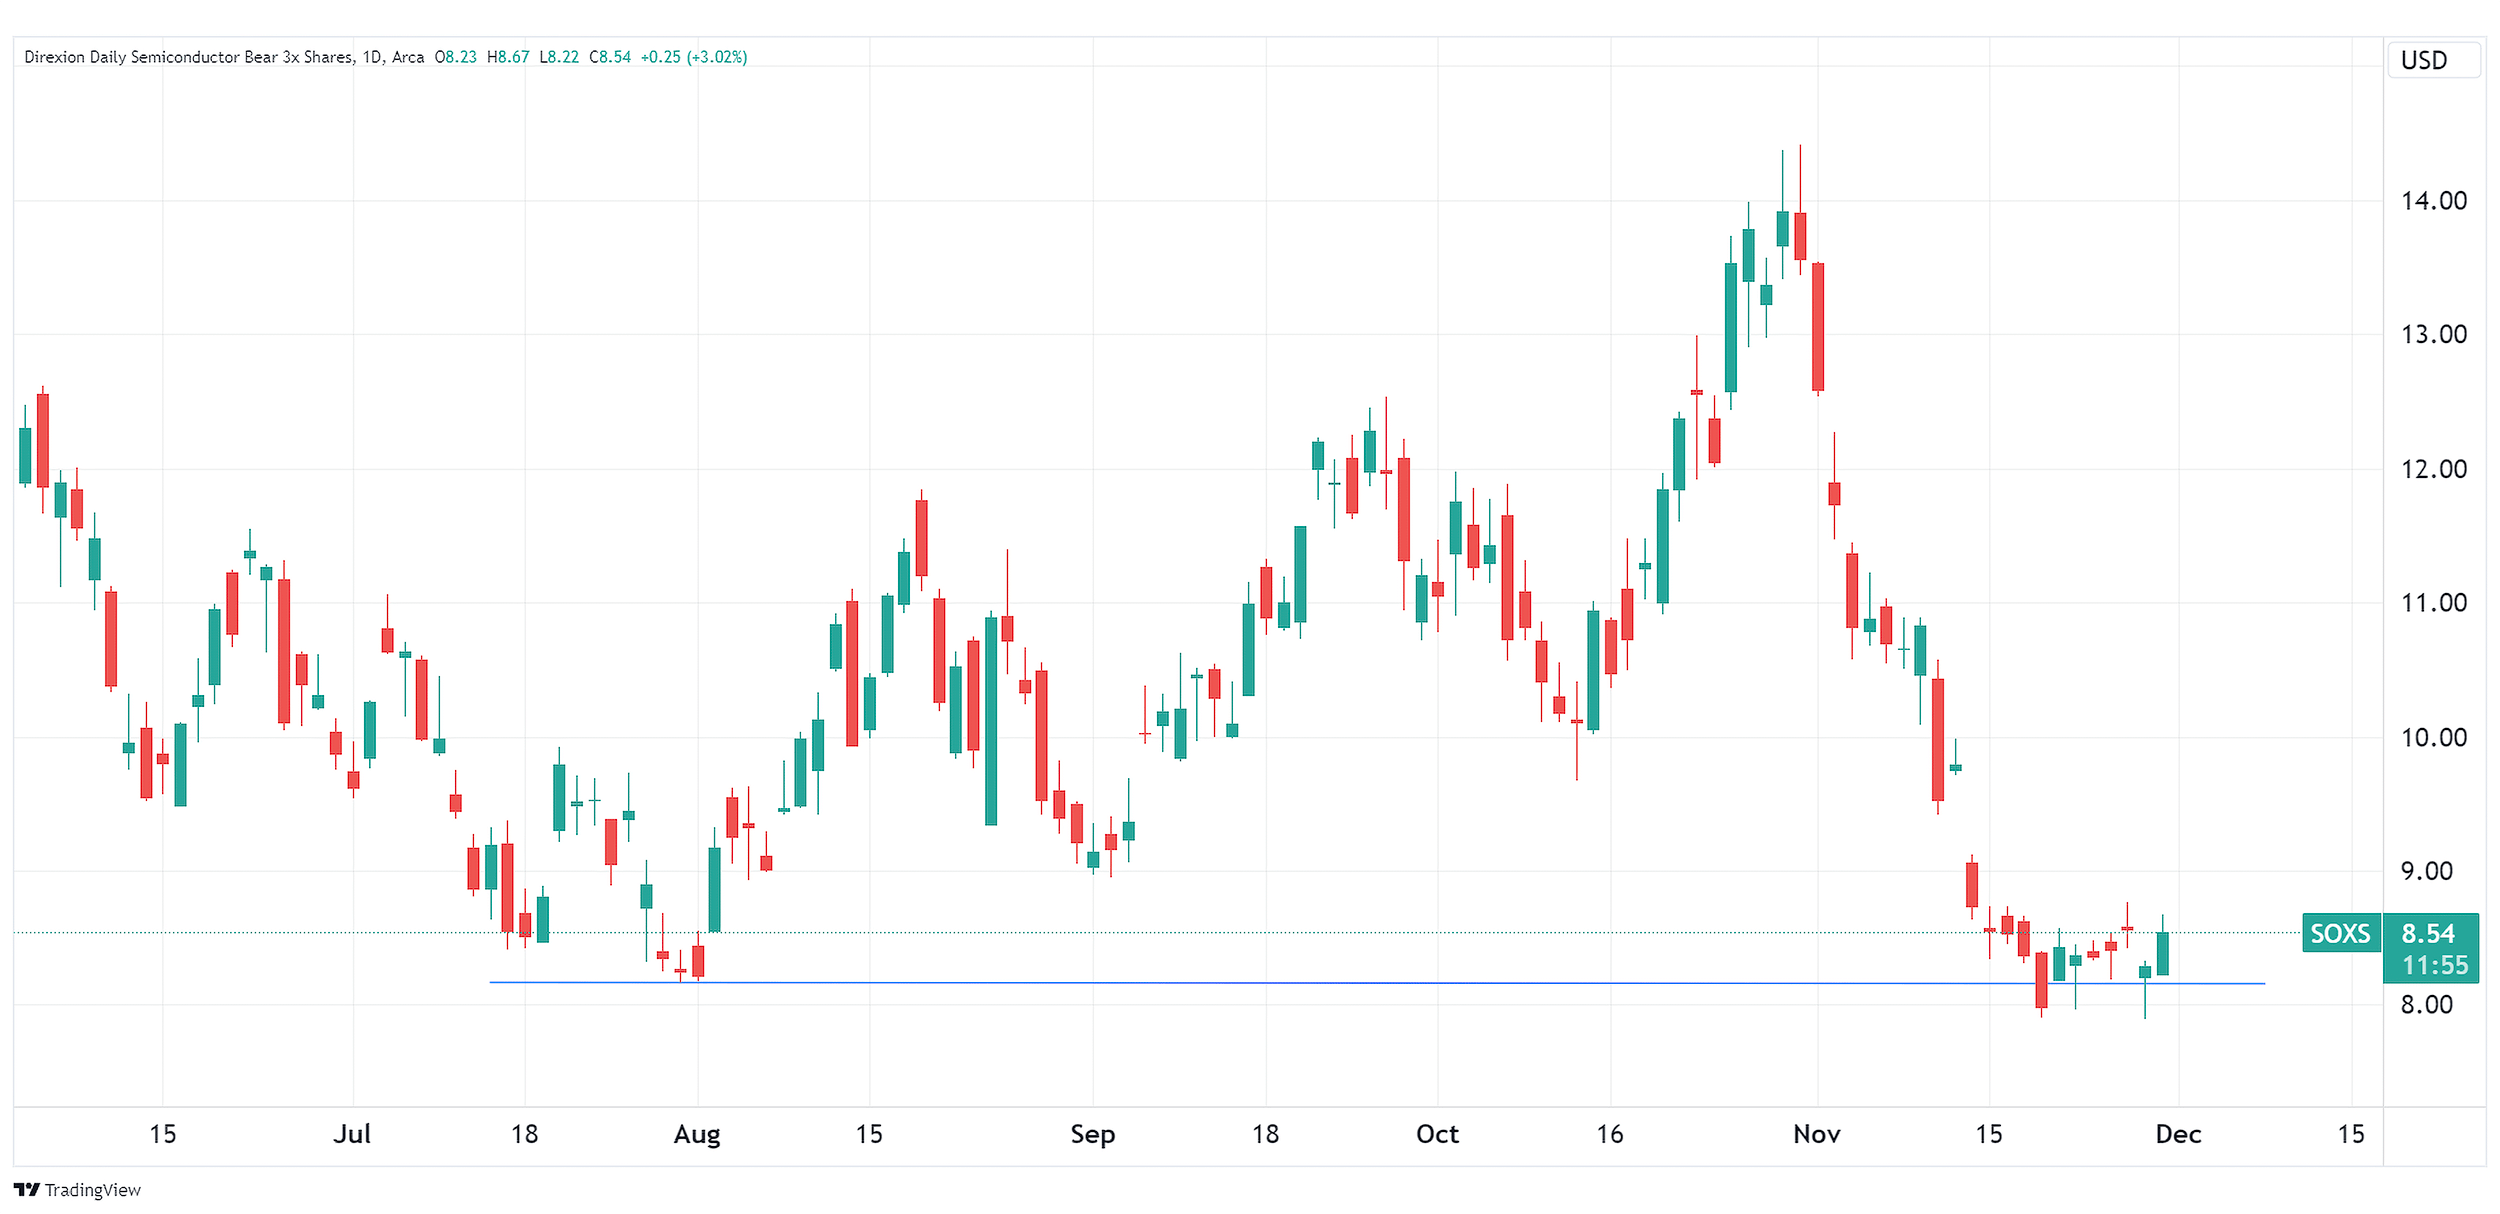
Source: TradingView.com
Candlestick charts display the high and low (the stick) and the open and close price (the body) of a security for a specific period. If the body is filled, it means the close was lower than the open. If the body is empty, it means the close was higher than the open.
The performance data quoted represents past performance. Past performance does not guarantee future results. The investment return and principal value of an investment will fluctuate. An investor’s shares, when redeemed, may be worth more or less than their original cost; current performance may be lower or higher than the performance quoted. For the most recent month-end performance go to Direxion.com/etfs. For standardized performance click here.
More Ways to Speculate on AI, Tech, & Chips
Traders looking to position themselves in the artificial intelligence space may like the Direxion Daily Robotics, Artificial Intelligence & Automation Index Bull 2X Shares (Ticker: UBOT), which seeks to provide, before fees and expenses, 200% of the daily performance of the Indxx Global Robotics and Artificial Intelligence Thematic Index*.
Direxion also offers a means to speculate on individual equities, either with leverage or inverse. The Direxion Daily AMZN Bull 1.5X Shares (Ticker: AMZU) seeks to provide, before fees and expenses, 150% of the daily performance of Amazon.com, Inc. common stock (Ticker: AMZN), while the Direxion Daily AMZN Bear 1X Shares (Ticker: AMZD) seeks to provide, before fees and expenses, 100% of the daily inverse performance of Amazon.com, Inc. common stock.
There’s also the Direxion Daily NVDA Bull 1.5X Shares (Ticker: NVDU), which seeks to provide, before fees and expenses, 150% of the daily performance of NVIDIA Corporation common stock (Ticker: NVDA), while the Direxion Daily NVDA Bear 1X Shares (Ticker: NVDD) seeks to provide, before fees and expenses, 100% of the daily inverse performance of NVIDIA Corporation common stock.
*Definitions and Index Descriptions
An investor should carefully consider a Fund’s investment objective, risks, charges, and expenses before investing. A Fund’s prospectus and summary prospectus contain this and other information about the Direxion Shares. To obtain a Fund’s prospectus and summary prospectus call 866-476-7523 or visit our website at www.direxion.com. A Fund’s prospectus and summary prospectus should be read carefully before investing.
Leveraged and Inverse ETFs pursue daily leveraged investment objectives, which mean they are riskier than alternatives that do not use leverage. They seek daily goals and should not be expected to track the underlying index over periods longer than one day. They are not suitable for all investors and should be utilized only by sophisticated investors who understand leverage risk and who actively manage their investments.
Neither Rafferty nor the Direxion Daily Semiconductor Bull 3X Shares and the Direxion Daily Semiconductor Bear 3X Shares (the “Financial Products”) are sponsored, endorsed, sold or promoted by Interactive Data Pricing and Reference Data, LLC or its affiliates (“Vendor”). Vendor makes no representation or warranty regarding the advisability of investing in securities generally, in the Financial Products particularly, or the ability of the NYSE Semiconductor Index to track general financial market performance. VENDOR MAKES NO EXPRESS OR IMPLIED WARRANTIES, AND HEREBY EXPRESSLY DISCLAIMS ALL WARRANTIES OF MERCHANTABILITY OR FITNESS FOR A PARTICULAR PURPOSE WITH RESPECT TO THE INDEX OR ANY DATA INCLUDED THEREIN. IN NO EVENT SHALL VENDOR HAVE ANY LIABILITY FOR ANY SPECIAL, PUNITIVE, INDIRECT, OR CONSEQUENTIAL DAMAGES (INCLUDING LOST PROFITS), EVEN IF NOTIFIED OF THE POSSIBILITY OF SUCH DAMAGES.
NYSE Semiconductor Index (ICESEMI) is a rules-based, modified float-adjusted market capitalization-weighted index that tracks the performance of the thirty largest U.S. listed semiconductor companies.
The Indxx Global Robotics and Artificial Intelligence Thematic Index (IBOTZNT) is designed to provide exposure to exchange-listed companies in developed markets that are expected to benefit from the adoption and utilization of robotics and/or artificial intelligence, including companies involved in developing industrial robots and production systems, automated inventory management, unmanned vehicles, voice/image/text recognition, and medical robots or robotic instruments, as defined by the index provider, Indxx. Companies must have a minimum market capitalization of $100 million and a minimum average daily turnover for the last 6 months greater than, or equal to, $2 million in order to be eligible for inclusion in the Index.
One cannot directly invest in an index.
Direxion Shares Risks – An investment in each Fund involves risk, including the possible loss of principal. Each Fund is non-diversified and includes risks associated with the Funds’ concentrating their investments in a particular industry, sector, or geographic region which can result in increased volatility. The use of derivatives such as futures contracts and swaps are subject to market risks that may cause their price to fluctuate over time. Risks of each Fund include Effects of Compounding and Market Volatility Risk, Leverage Risk, Market Risk, Counterparty Risk, Rebalancing Risk, Intra-Day Investment Risk, Other Investment Companies (including ETFs) Risk, Cash Transaction Risk, Tax Risk, and risks specific to the Semiconductor Industry. Companies that are in the semiconductor industry may be affected by particular economic or market events, which may, in certain circumstances, cause the value of securities of all companies in the semiconductor sector of the market to decrease. Additional risks include, for the Direxion Daily Semiconductor Bull 3X Shares, Daily Index Correlation Risk, and for the Direxion Daily Semiconductor Bear 3X Shares, Daily Inverse Index Correlation Risk, and risks related to Shorting. Please see the summary and full prospectuses for a more complete description of these and other risks of each Fund.
Distributor: Foreside Fund Services, LLC.