Interest Rate Cuts? Trading a Real Estate Shift.

Editor's note: Any and all references to time frames longer than one trading day are for purposes of market context only, and not recommendations of any holding time frame. Daily rebalancing ETFs are not meant to be held unmonitored for long periods. If you don't have the resources, time or inclination to constantly monitor and manage your positions, leveraged and inverse ETFs are not for you.
In many ways, the real estate market was frozen in 2023. Existing home sales collapsed to multi-decade lows, largely due to skyrocketing borrowing costs, which trapped many homeowners in their current locations. However, with the prospect of interest rate cuts in 2024, could there be a bourgeoning opportunity in the real estate space?
Is it as Simple as Interest Rates?
In light of softer inflation* data and a slightly cooling labor market, the market’s expectations for the Fed to ease at some point in 2024 has increased notably. For the past year or so, the average interest rate on a 30-year mortgage has steadily climbing.
The demand destruction witnessed in the real estate sector during this period was profound, and not limited to the residential market. The commercial real estate market also suffered as vacancy rates remained at elevated levels, and companies struggled to attract workers back to the office.
However, real estate prices overall managed to remain afloat due to inventory shortages, especially in the residential space. If we see some relief on the interest rate front next year, it could be a catalyst for a rebound in the real estate sector. In such a scenario, traders may find an opportunity with Direxion’s Daily Real Estate Bull 3X Shares (Ticker: DRN), which seeks daily investment results, before fees and expenses, of 300% of the performance of the Real Estate Select Sector Index*.
Below is a daily chart of DRN as of December 8, 2023.
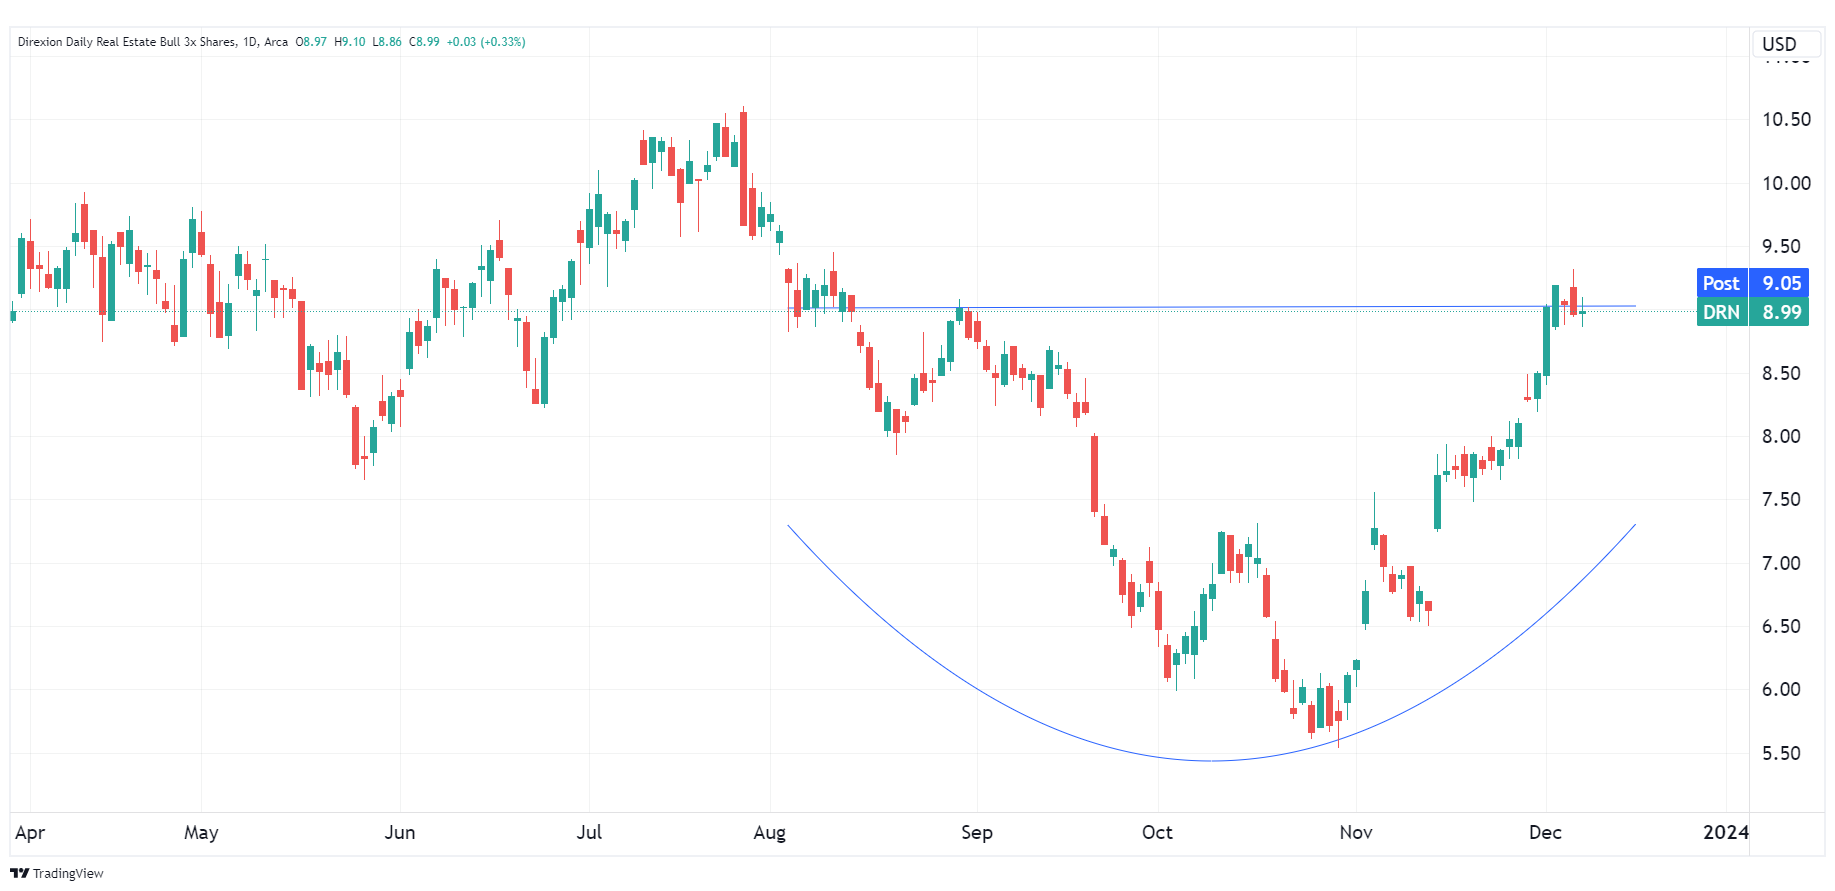
Source: TradingView.com
Candlestick charts display the high and low (the stick) and the open and close price (the body) of a security for a specific period. If the body is filled, it means the close was lower than the open. If the body is empty, it means the close was higher than the open.
The performance data quoted represents past performance. Past performance does not guarantee future results. The investment return and principal value of an investment will fluctuate. An investor’s shares, when redeemed, may be worth more or less than their original cost; current performance may be lower or higher than the performance quoted. For the most recent month-end performance go to Direxion.com/etfs. For standardized performance click here.
Is Affordability the Bigger Issue?
The fact that real estate prices have consolidated their impressive gains of recent years instead of correcting also presents an affordability problem. Interest rates would likely have to decline substantially for demand to accelerate again.
Ultimately, the catalyst for this will be inflation. If inflationary pressures remain subdued, it will give the Fed some wiggle room to cut interest rates. But we must also recognize that rates could fall due to a slowing economy, and if unemployment rises, the public may not be in a position to transact in real estate.
Traders would be wise to keep watch on inflation and employment data. The November inflation report showed that consumer price index* (CPI) has increased 3.1% compared to one year earlier, which is cooler than the October report. The next employment report will be released on January 5, 2024. Softer inflation and employment data could signal an economic slowdown and be a potential catalyst for further weakness in the real estate space.
Traders that think an economic slowdown could slow real estate demand may find a position with Direxion’s Daily Real Estate Bear 3X Shares (Ticker: DRV), which seeks daily investment results, before fees and expenses, of -300% of the performance of the Real Estate Select Sector Index.
Below is a daily chart of DRV as of December 8, 2023.
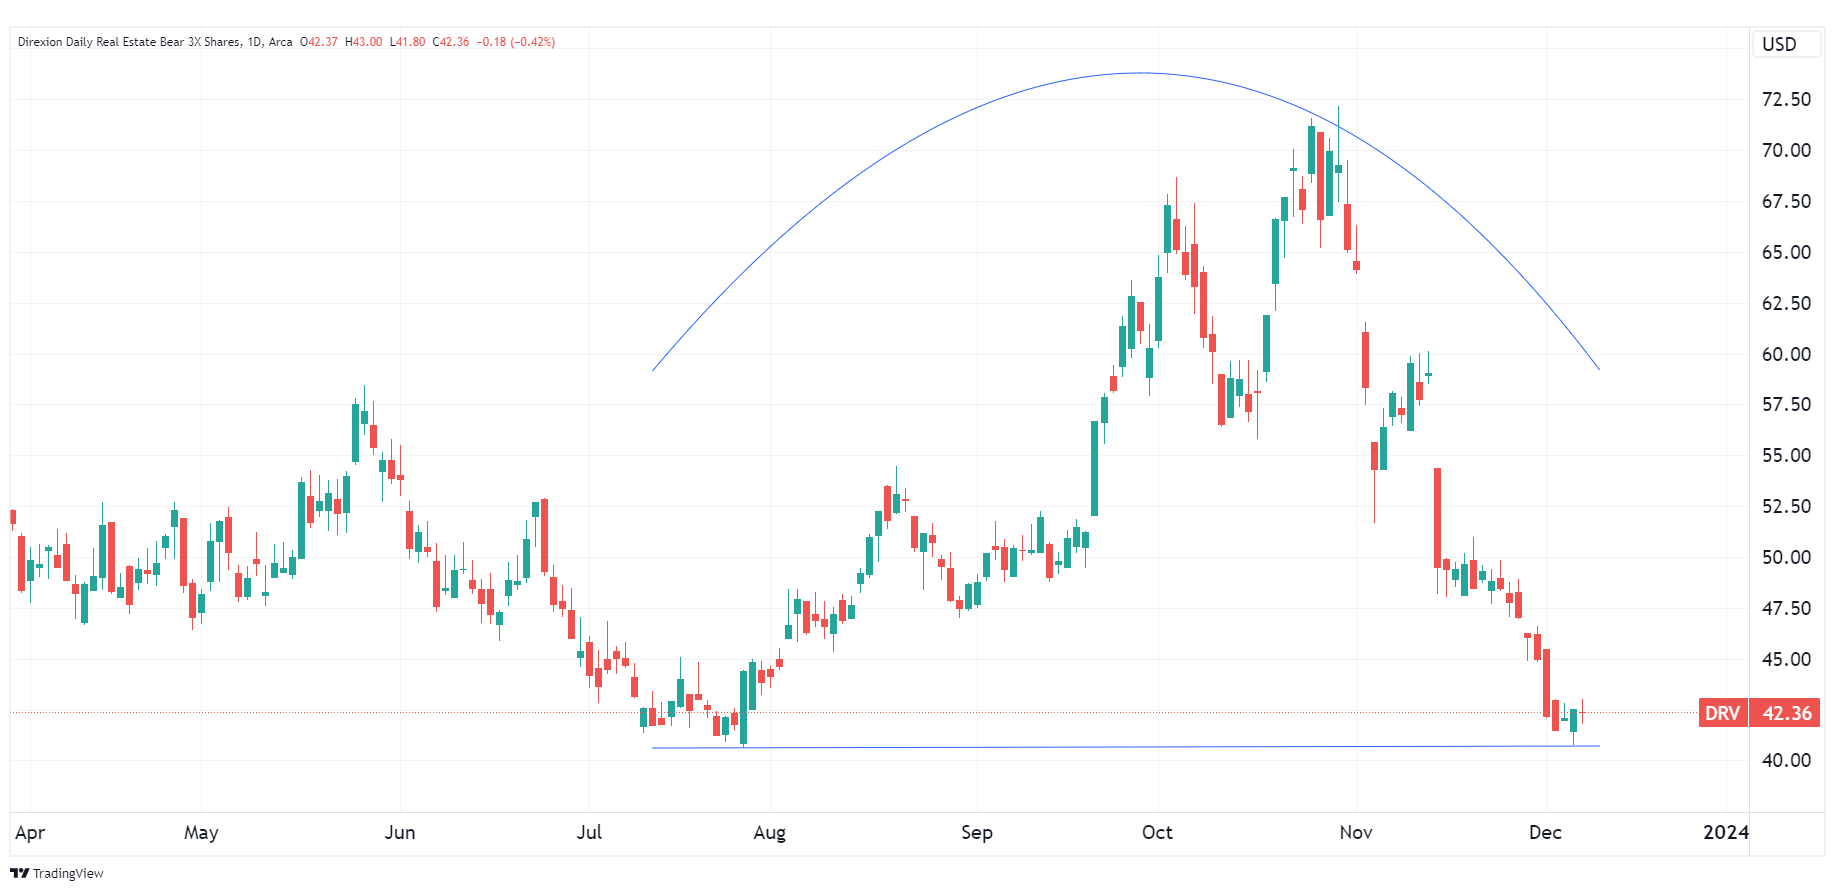
Source: TradingView.com
Candlestick charts display the high and low (the stick) and the open and close price (the body) of a security for a specific period. If the body is filled, it means the close was lower than the open. If the body is empty, it means the close was higher than the open.
The performance data quoted represents past performance. Past performance does not guarantee future results. The investment return and principal value of an investment will fluctuate. An investor’s shares, when redeemed, may be worth more or less than their original cost; current performance may be lower or higher than the performance quoted. For the most recent month-end performance go to Direxion.com/etfs. For standardized performance click here.
Additional Real Estate and Interest Rate Plays
Traders looking for position in the homebuilding sector exclusively may like the Direxion Daily Homebuilders & Supplies Bull 3X Shares (Ticker: NAIL), which seeks daily investment results, before fees and expenses, of 300% of the performance of the Dow Jones U.S. Select Home Construction Index*.
Direxion also offers a means to speculate in the Treasury market. The Direxion Daily 20+ Year Treasury Bull 3X Shares (Ticker: TMF) seeks daily investment results, before fees and expenses, of 300% of the performance of the ICE U.S. Treasury 20+ Year Bond Index*, while the Direxion Daily 20+ Year Treasury Bear 3X Shares (Ticker: TMV) seeks daily investment results, before fees and expenses, of -300% of the performance of the ICE U.S. Treasury 20+ Year Bond Index.
*Definitions and Index Descriptions
An investor should carefully consider a Fund’s investment objective, risks, charges, and expenses before investing. A Fund’s prospectus and summary prospectus contain this and other information about the Direxion Shares. To obtain a Fund’s prospectus and summary prospectus call 866-476-7523 or visit our website at www.direxion.com. A Fund’s prospectus and summary prospectus should be read carefully before investing.
Leveraged and Inverse ETFs pursue daily leveraged investment objectives which means they are riskier than alternatives which do not use leverage. They seek daily goals and should not be expected to track the underlying index over periods longer than one day. They are not suitable for all investors and should be utilized only by sophisticated investors who understand leverage risk and who actively manage their investments.
The Real Estate Select Sector Index is provided by S&P Dow Jones Indices and includes securities of companies from the following industries: real estate management and development and real estate investment trusts (“REITs”), excluding mortgage REITs.
The Dow Jones U.S. Select Home Construction Index measures U.S companies in the home construction sector that provide a wide range of products and services related to homebuilding, including home construction and producers, sellers and suppliers of building materials, furnishings and fixtures and also home improvement retailers. The Index may include large-, mid- or small-capitalization companies.
The ICE U.S. Treasury 20+ Year Bond Index (IDCOT20TR) is a market value weighted index that includes publicly issued U.S. Treasury securities that have a remaining maturity of greater than 20 years. Eligible securities must be fixed rate, denominated in U.S. dollars, and have $300 million or more of outstanding face value, excluding amounts held by the Federal Reserve. Securities excluded from the Index are inflation-linked securities, Treasury bills, cash management bills, any government agency debt issued with or without a government guarantee and zero-coupon issues that have been stripped from coupon-paying bonds.
One cannot directly invest in an index.
Direxion Shares Risks – An investment in each Fund involves risk, including the possible loss of principal. Each Fund is non-diversified and includes risks associated with the Funds concentrating their investments in a particular industry, sector, or geographic region which can result in increased volatility. The use of derivatives such as futures contracts and swaps are subject to market risks that may cause their price to fluctuate over time. Risks of each Fund include Effects of Compounding and Market Volatility Risk, Leverage Risk, Market Risk, Counterparty Risk, Rebalancing Risk, Intra-Day Investment Risk, Other Investment Companies (including ETFs) Risk, Cash Transaction Risk, Tax Risk, and risks specific to the securities of the Real Estate Sector. Real estate securities are subject to risks similar to those associated with direct ownership of real estate, including changes in local and general economic conditions, supply and demand, interest rates, environmental liability, zoning laws, regulatory limitations on rent, property taxes, operating expenses and losses from casualty or condemnation. Additional risks include, for the Direxion Daily Real Estate Bull 3X Shares, Daily Index Correlation Risk, and for the Direxion Daily Real Estate Bear 3X Shares, Daily Inverse Index Correlation Risk, and risks related to Shorting. Please see the summary and full prospectuses for a more complete description of these and other risks of each Fund.
Distributor: Foreside Fund Services, LLC.