Q4 2023 Earnings Calendar

Editor’s note: Any and all references to time frames longer than one trading day are for purposes of market context only, and not recommendations of any holding time frame. Daily rebalancing ETFs are not meant to be held unmonitored for long periods. If you don't have the resources, time or inclination to constantly monitor and manage your positions, leveraged and inverse ETFs are not for you.
With the impending onset of fourth-quarter earnings season, the backdrop is riddled with challenges. Escalating interest rates are exerting pressure on both consumers and corporations in the U.S., amplifying borrowing costs and dampening investment enthusiasm, thus stunting economic expansion. Simultaneously, inflationary forces are amplifying input costs for American companies, constricting profit margins and putting a strain on overall earnings.
Looking ahead, Q4 earnings season is set to commence this month, carrying the anticipation of yet another period of subdued growth. As per Wall Street consensus estimates, S&P 500 companies are expected to witness a moderate 2.4% earnings growth alongside a 3.1% revenue uptick in the fourth quarter according to Forbes.
Analytical projections for the full-year 2024 envisage a robust 11.5% earnings growth for the S&P 500 (Forbes). However, the optimism among Wall Street analysts varies across market sectors. The energy sector commands the highest percentage of analyst "buy" ratings at an impressive 64%, closely followed by communication services at 62% (Forbes).
Drawing attention to market sentiments, the consensus among analysts outlines a 12-month price target for the S&P 500 at 5,090, reflecting approximately 6% upside potential from current levels (Forbes). Others, like Chief Investment Officer for Commonwealth Financial Network, Brad McMillan, believe that 2024 might not yield significant upside for the S&P 500. He suggests, "As equity markets grapple with prevailing concerns and investors acclimate to the 'higher-for-longer' rates narrative, we anticipate the S&P 500 reaching a year-end range between 4,700 and 4,800."
Overall, the market's expectations for the 2023 fourth quarter earnings forecasts are a delicate balance between optimism about the ongoing recovery and vigilance regarding the challenges that could potentially hinder corporate performance.
Here’s a list of announcement dates with related Leveraged & Inverse ETFs, week-by-week for 2023’s Q4 earnings season.
Earnings dates are subject to change without notice.
Q4 2023 Earnings Season - % of Each Index Reporting by Week
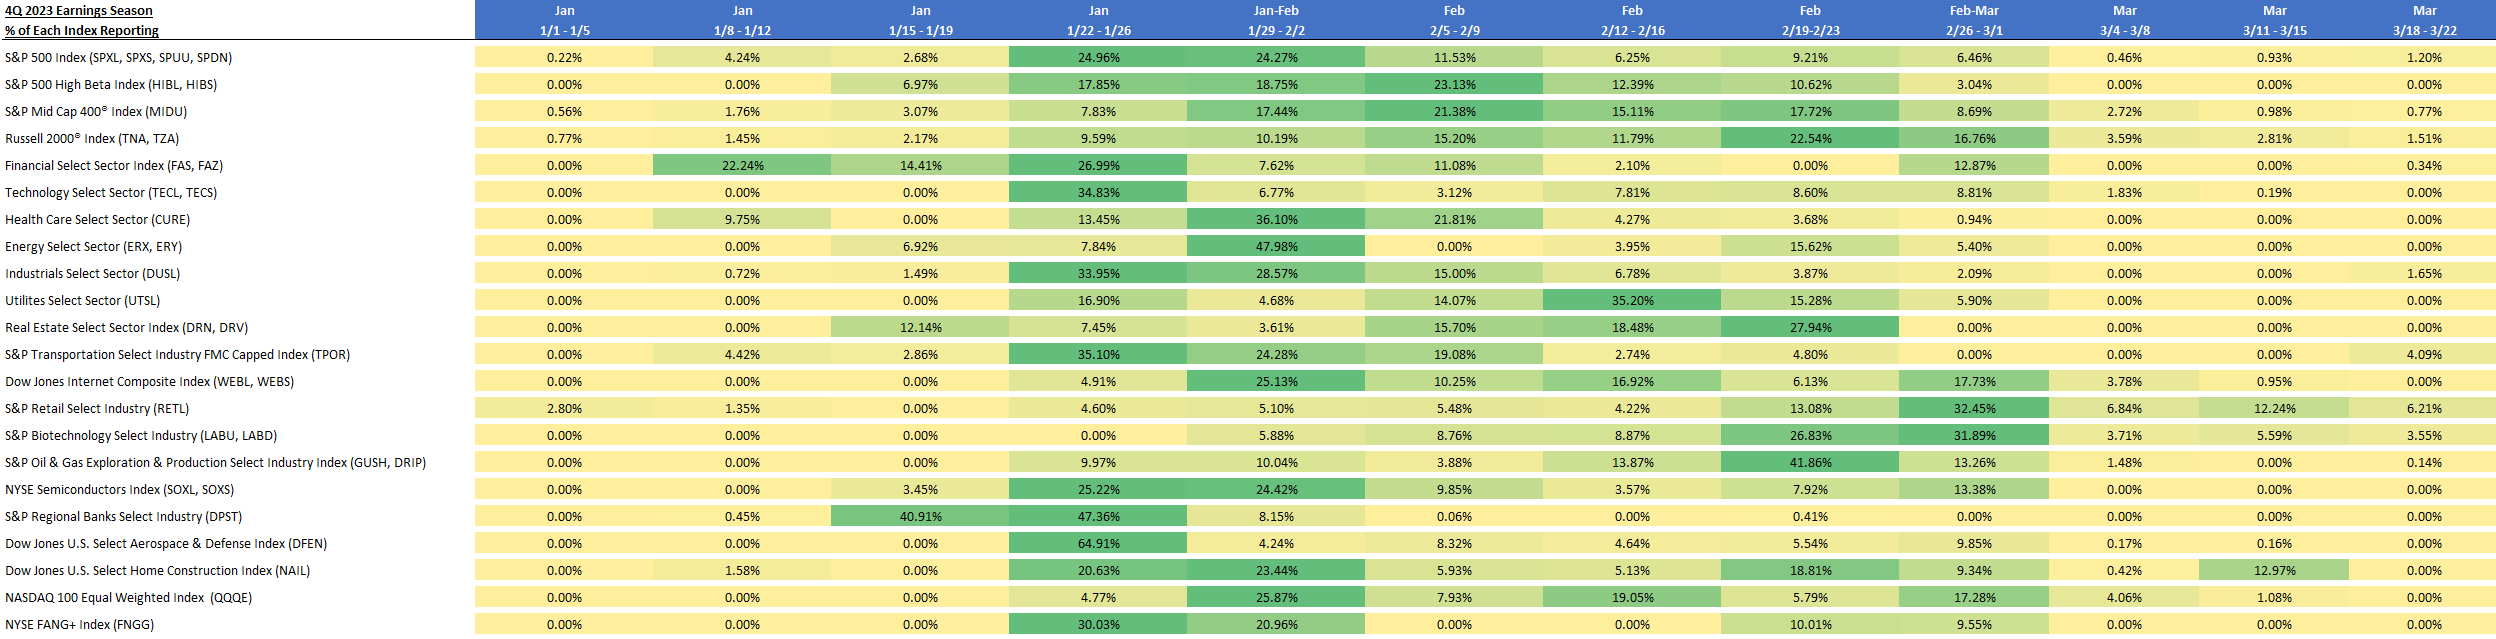
Source: Bloomberg Data Management Services. Figures represent percent of companies in each index expected to release earnings reports by week. Green shading identifies the week with the highest percentages. Index descriptions are provided at the end of the page. One cannot directly invest in an index.
S&P 500 Index
| Ticker | Name | Weight in the Index | Expected Earnings Release |
| MSFT UW | Microsoft Corp | 6.99% | 1/24/2024 |
| AMZN UW | Amazon.com Inc | 3.46% | 2/2/2024 |
| NVDA UW | NVIDIA Corp | 2.98% | 2/20/2024 |
| GOOGL UW | Alphabet Inc | 2.07% | 2/2/2024 |
| META UW | Meta Platforms Inc | 1.94% | 2/1/2024 |
| GOOG UW | Alphabet Inc | 1.76% | 2/2/2024 |
| BRK/B UN | Berkshire Hathaway Inc | 1.68% | 2/26/2024 |
| TSLA UW | Tesla Inc | 1.67% | 1/24/2024 |
| UNH UN | UnitedHealth Group Inc | 1.27% | 1/12/2024 |
| JPM UN | JPMorgan Chase & Co | 1.25% | 1/12/2024 |
S&P 500 High Beta Index
| Ticker | Name | Weight in the Index | Expected Earnings Release |
| CCL UN | Carnival Corp | 1.53% | 3/27/2024 |
| GNRC UN | Generac Holdings Inc | 1.37% | 2/15/2024 |
| MPWR UW | Monolithic Power Systems Inc | 1.36% | 2/8/2024 |
| ENPH UQ | Enphase Energy Inc | 1.33% | 2/7/2024 |
| AMD UW | Advanced Micro Devices Inc | 1.33% | 1/31/2024 |
| ALGN UW | Align Technology Inc | 1.32% | 1/31/2024 |
| BX UN | Blackstone Inc | 1.29% | 1/26/2024 |
| ZION UW | Zions Bancorp NA | 1.28% | 1/23/2024 |
| ON UW | ON Semiconductor Corp | 1.27% | 2/6/2024 |
| NVDA UW | NVIDIA Corp | 1.26% | 2/20/2024 |
Financials Select Sector Index
| Ticker | Name | Weight in the Index | Expected Earnings Release |
| BRK/B UN | Berkshire Hathaway Inc | 12.87% | 2/26/2024 |
| JPM UN | JPMorgan Chase & Co | 9.55% | 1/12/2024 |
| V UN | Visa Inc | 7.94% | 1/26/2024 |
| MA UN | Mastercard Inc | 6.71% | 1/26/2024 |
| BAC UN | Bank of America Corp | 4.44% | 1/12/2024 |
| WFC UN | Wells Fargo & Co | 3.40% | 1/12/2024 |
| SPGI UN | S&P Global Inc | 2.70% | 2/9/2024 |
| GS UN | Goldman Sachs Group Inc/The | 2.39% | 1/16/2024 |
| MS UN | Morgan Stanley | 2.24% | 1/16/2024 |
| BLK UN | BlackRock Inc | 2.12% | 1/12/2024 |
Health Care Select Sector Index
| Ticker | Name | Weight in the Index | Expected Earnings Release |
| UNH UN | UnitedHealth Group Inc | 9.75% | 1/12/2024 |
| LLY UN | Eli Lilly & Co | 9.49% | 2/6/2024 |
| JNJ UN | Johnson & Johnson | 7.52% | 1/23/2024 |
| MRK UN | Merck & Co Inc | 5.68% | 2/1/2024 |
| TMO UN | Thermo Fisher Scientific Inc | 4.00% | 1/31/2024 |
| PFE UN | Pfizer Inc | 3.28% | 1/30/2024 |
| AMGN UW | Amgen Inc | 3.13% | 1/31/2024 |
| DHR UN | Danaher Corp | 2.95% | 1/30/2024 |
| ELV UN | Elevance Health Inc | 2.21% | 1/25/2024 |
| ISRG UW | Intuitive Surgical Inc | 2.20% | 1/23/2024 |
Industrials Select Sector Index
| Ticker | Name | Weight in the Index | Expected Earnings Release |
| UNP UN | Union Pacific Corp | 4.28% | 1/25/2024 |
| CAT UN | Caterpillar Inc | 4.20% | 1/31/2024 |
| BA UN | Boeing Co/The | 4.06% | 1/25/2024 |
| HON UW | Honeywell International Inc | 3.93% | 2/2/2024 |
| GE UN | General Electric Co | 3.92% | 1/23/2024 |
| RTX UN | RTX Corp | 3.60% | 1/23/2024 |
| UBER UN | Uber Technologies Inc | 3.49% | 2/8/2024 |
| UPS UN | United Parcel Service Inc | 3.28% | 1/30/2024 |
| DE UN | Deere & Co | 3.07% | 2/16/2024 |
| LMT UN | Lockheed Martin Corp | 2.96% | 1/24/2024 |
Real Estate Select Sector Index
| Ticker | Name | Weight in the Index | Expected Earnings Release |
| PLD UN | Prologis Inc | 12.14% | 1/17/2024 |
| EQIX UW | Equinix Inc | 7.53% | 2/15/2024 |
| WELL UN | Welltower Inc | 4.96% | 2/15/2024 |
| CCI UN | Crown Castle Inc | 4.96% | 1/25/2024 |
| PSA UN | Public Storage | 4.84% | 2/21/2024 |
| SPG UN | Simon Property Group Inc | 4.58% | 2/6/2024 |
| O UN | Realty Income Corp | 4.17% | 2/21/2024 |
| DLR UN | Digital Realty Trust Inc | 4.03% | 2/16/2024 |
| CSGP UW | CoStar Group Inc | 3.42% | 2/20/2024 |
| EXR UN | Extra Space Storage Inc | 3.38% | 2/22/2024 |
Dow Jones Internet Composite Index
| Ticker | Name | Weight in the Index | Expected Earnings Release |
| META UW | Meta Platforms Inc | 7.52% | 2/1/2024 |
| GOOGL UW | Alphabet Inc | 5.16% | 2/2/2024 |
| CRM UN | Salesforce Inc | 5.11% | 3/1/2024 |
| CSCO UW | Cisco Systems Inc | 5.07% | 2/14/2024 |
| NFLX UW | Netflix Inc | 4.91% | 1/23/2024 |
| GOOG UW | Alphabet Inc | 4.46% | 2/2/2024 |
| PYPL UW | PayPal Holdings Inc | 3.61% | 2/9/2024 |
| SNOW UN | Snowflake Inc | 3.00% | 3/1/2024 |
| WDAY UW | Workday Inc | 2.93% | 2/27/2024 |
| ANET UN | Arista Networks Inc | 2.56% | 2/13/2024 |
S&P Biotechnology Select Industry Index
| Ticker | Name | Weight in the Index | Expected Earnings Release |
| CYTK UW | Cytokinetics Inc | 2.86% | 3/1/2024 |
| KRTX UQ | Karuna Therapeutics Inc | 1.76% | 2/23/2024 |
| MRNA UW | Moderna Inc | 1.58% | 2/23/2024 |
| ARWR UW | Arrowhead Pharmaceuticals Inc | 1.51% | 2/6/2024 |
| BHVN UN | Biohaven Ltd | 1.46% | 3/22/2024 |
| FOLD UQ | Amicus Therapeutics Inc | 1.42% | 2/28/2024 |
| BBIO UW | Bridgebio Pharma Inc | 1.40% | 2/23/2024 |
| BPMC UW | Blueprint Medicines Corp | 1.39% | 2/16/2024 |
| INCY UW | Incyte Corp | 1.38% | 2/7/2024 |
| RARE UW | Ultragenyx Pharmaceutical Inc | 1.36% | 2/16/2024 |
NYSE Semiconductor Index
| Ticker | Name | Weight in the Index | Expected Earnings Release |
| AVGO UW | Broadcom Inc | 8.80% | 3/1/2024 |
| AMD UW | Advanced Micro Devices Inc | 8.40% | 1/31/2024 |
| NVDA UW | NVIDIA Corp | 7.92% | 2/20/2024 |
| QCOM UW | QUALCOMM Inc | 6.38% | 2/2/2024 |
| INTC UW | Intel Corp | 6.31% | 1/26/2024 |
| TXN UW | Texas Instruments Inc | 4.07% | 1/24/2024 |
| MU UW | Micron Technology Inc | 4.05% | 3/28/2024 |
| NXPI UW | NXP Semiconductors NV | 3.94% | 1/30/2024 |
| ON UW | ON Semiconductor Corp | 3.88% | 2/6/2024 |
| LRCX UW | Lam Research Corp | 3.85% | 1/25/2024 |
Dow Jones U.S. Select Home Construction Index
| Ticker | Name | Weight in the Index | Expected Earnings Release |
| DHI UN | DR Horton Inc | 15.17% | 1/23/2024 |
| LEN UN | Lennar Corp | 12.39% | 3/14/2024 |
| NVR UN | NVR Inc | 7.53% | 1/31/2024 |
| PHM UN | PulteGroup Inc | 7.39% | 1/30/2024 |
| HD UN | Home Depot Inc/The | 4.33% | 2/20/2024 |
| SHW UN | Sherwin-Williams Co/The | 4.33% | 1/25/2024 |
| LOW UN | Lowe's Cos Inc | 4.28% | 3/1/2024 |
| BLD UN | TopBuild Corp | 3.85% | 2/23/2024 |
| TOL UN | Toll Brothers Inc | 3.62% | 2/21/2024 |
| BLDR UN | Builders FirstSource Inc | 2.88% | 2/28/2024 |
NASDAQ 100 Equal Weighted Index
| Ticker | Name | Weight in the Index | Expected Earnings Release |
| META UW | Meta Platforms Inc | 7.83% | 2/1/2024 |
| GOOGL UW | Alphabet Inc | 5.49% | 2/2/2024 |
| CRM UN | Salesforce Inc | 5.03% | 3/1/2024 |
| NFLX UW | Netflix Inc | 4.77% | 1/23/2024 |
| CSCO UW | Cisco Systems Inc | 4.70% | 2/14/2024 |
| GOOG UW | Alphabet Inc | 4.67% | 2/2/2024 |
| ANET UN | Arista Networks Inc | 3.07% | 2/13/2024 |
| PYPL UW | PayPal Holdings Inc | 3.02% | 2/9/2024 |
| SNOW UN | Snowflake Inc | 3.02% | 3/1/2024 |
| WDAY UW | Workday Inc | 2.88% | 2/27/2024 |
S&P Mid Cap 400® Index
| Ticker | Name | Weight in the Index | Expected Earnings Release |
| DECK UN | Deckers Outdoor Corp | 0.70% | 2/2/2024 |
| RS UN | Reliance Steel & Aluminum Co | 0.65% | 2/15/2024 |
| CSL UN | Carlisle Cos Inc | 0.60% | 2/6/2024 |
| GDDY UN | GoDaddy Inc | 0.59% | 2/14/2024 |
| WPC UN | WP Carey Inc | 0.57% | 2/9/2024 |
| GGG UN | Graco Inc | 0.57% | 1/30/2024 |
| WSO UN | Watsco Inc | 0.57% | 2/16/2024 |
| RPM UN | RPM International Inc | 0.56% | 1/4/2024 |
| LII UN | Lennox International Inc | 0.56% | 1/31/2024 |
| SMCI UW | Super Micro Computer Inc | 0.54% | 1/31/2024 |
Russell 2000® Index
| Ticker | Name | Weight in the Index | Expected Earnings Release |
| SMCI UW | Super Micro Computer Inc | 0.53% | 1/31/2024 |
| SSD UN | Simpson Manufacturing Co Inc | 0.33% | 2/6/2024 |
| CYTK UW | Cytokinetics Inc | 0.32% | 3/1/2024 |
| MSTR UW | MicroStrategy Inc | 0.31% | 2/2/2024 |
| ELF UN | elf Beauty Inc | 0.30% | 2/6/2024 |
| LNW UW | Light & Wonder Inc | 0.29% | 3/1/2024 |
| UFPI UW | UFP Industries Inc | 0.29% | 2/21/2024 |
| CHRD UW | Chord Energy Corp | 0.29% | 2/22/2024 |
| IMGN UW | ImmunoGen Inc | 0.29% | 3/1/2024 |
| RMBS UW | Rambus Inc | 0.29% | 2/6/2024 |
Technology Select Sector Index
| Ticker | Name | Weight in the Index | Expected Earnings Release |
| MSFT UW | Microsoft Corp | 22.93% | 1/24/2024 |
| AVGO UW | Broadcom Inc | 5.10% | 3/1/2024 |
| NVDA UW | NVIDIA Corp | 4.53% | 2/20/2024 |
| CRM UN | Salesforce Inc | 2.77% | 3/1/2024 |
| AMD UW | Advanced Micro Devices Inc | 2.46% | 1/31/2024 |
| CSCO UW | Cisco Systems Inc | 2.29% | 2/14/2024 |
| INTC UW | Intel Corp | 2.24% | 1/26/2024 |
| INTU UW | Intuit Inc | 1.87% | 2/23/2024 |
| ORCL UN | Oracle Corp | 1.83% | 3/8/2024 |
| QCOM UW | QUALCOMM Inc | 1.72% | 2/2/2024 |
Energy Select Sector Index
| Ticker | Name | Weight in the Index | Expected Earnings Release |
| XOM UN | Exxon Mobil Corp | 22.68% | 1/31/2024 |
| CVX UN | Chevron Corp | 17.40% | 2/2/2024 |
| EOG UN | EOG Resources Inc | 4.71% | 2/23/2024 |
| SLB UN | Schlumberger NV | 4.62% | 1/19/2024 |
| MPC UN | Marathon Petroleum Corp | 3.95% | 1/30/2024 |
| PSX UN | Phillips 66 | 3.94% | 1/31/2024 |
| PXD UN | Pioneer Natural Resources Co | 3.58% | 2/22/2024 |
| VLO UN | Valero Energy Corp | 2.99% | 1/25/2024 |
| WMB UN | Williams Cos Inc/The | 2.90% | 2/20/2024 |
| OKE UN | ONEOK Inc | 2.76% | 2/27/2024 |
Utilities Select Sector Index
| Ticker | Name | Weight in the Index | Expected Earnings Release |
| NEE UN | NextEra Energy Inc | 13.21% | 1/25/2024 |
| SO UN | Southern Co/The | 8.23% | 2/16/2024 |
| DUK UN | Duke Energy Corp | 7.98% | 2/9/2024 |
| SRE UN | Sempra | 5.02% | 2/28/2024 |
| D UN | Dominion Energy Inc | 4.25% | 2/8/2024 |
| PCG UN | PG&E Corp | 4.05% | 2/23/2024 |
| CEG UW | Constellation Energy Corp | 3.94% | 2/16/2024 |
| EXC UW | Exelon Corp | 3.80% | 2/14/2024 |
| XEL UW | Xcel Energy Inc | 3.69% | 1/26/2024 |
| ED UN | Consolidated Edison Inc | 3.37% | 2/16/2024 |
S&P Transportation Select Industry FMC Capped Index
| Ticker | Name | Weight in the Index | Expected Earnings Release |
| UNP UN | Union Pacific Corp | 18.43% | 1/25/2024 |
| UBER UN | Uber Technologies Inc | 15.03% | 2/8/2024 |
| UPS UN | United Parcel Service Inc | 11.40% | 1/30/2024 |
| ODFL UW | Old Dominion Freight Line Inc | 4.60% | 2/1/2024 |
| CSX UW | CSX Corp | 4.58% | 1/25/2024 |
| NSC UN | Norfolk Southern Corp | 4.53% | 1/25/2024 |
| DAL UN | Delta Air Lines Inc | 4.42% | 1/12/2024 |
| FDX UN | FedEx Corp | 4.09% | 3/21/2024 |
| EXPD UN | Expeditors International of Washington Inc | 3.37% | 2/20/2024 |
| LUV UN | Southwest Airlines Co | 3.01% | 1/25/2024 |
S&P Retail Select Industry Index
| Ticker | Name | Weight in the Index | Expected Earnings Release |
| WRBY UN | Warby Parker Inc | 1.66% | 2/28/2024 |
| LESL UW | Leslie's Inc | 1.62% | 2/2/2024 |
| SBH UN | Sally Beauty Holdings Inc | 1.58% | 2/2/2024 |
| ASO UW | Academy Sports & Outdoors Inc | 1.56% | 3/15/2024 |
| CVNA UN | Carvana Co | 1.55% | 2/23/2024 |
| LAD UN | Lithia Motors Inc | 1.53% | 2/15/2024 |
| BBWI UN | Bath & Body Works Inc | 1.53% | 2/23/2024 |
| ANF UN | Abercrombie & Fitch Co | 1.53% | 3/1/2024 |
| DLTR UW | Dollar Tree Inc | 1.50% | 3/1/2024 |
| WBA UW | Walgreens Boots Alliance Inc | 1.48% | 1/4/2024 |
S&P Oil & Gas Exploration & Production Select Industry Index
| Ticker | Name | Weight in the Index | Expected Earnings Release |
| SM UN | SM Energy Co | 2.59% | 2/22/2024 |
| MPC UN | Marathon Petroleum Corp | 2.59% | 1/30/2024 |
| CPE UN | Callon Petroleum Co | 2.57% | 2/21/2024 |
| HES UN | Hess Corp | 2.56% | 1/25/2024 |
| PSX UN | Phillips 66 | 2.55% | 1/31/2024 |
| VLO UN | Valero Energy Corp | 2.55% | 1/25/2024 |
| CHRD UW | Chord Energy Corp | 2.54% | 2/22/2024 |
| PBF UN | PBF Energy Inc | 2.53% | 2/15/2024 |
| OXY UN | Occidental Petroleum Corp | 2.51% | 2/26/2024 |
| DINO UN | HF Sinclair Corp | 2.51% | 2/23/2024 |
S&P Regional Banks Select Industry Index
| Ticker | Name | Weight in the Index | Expected Earnings Release |
| CFG UN | Citizens Financial Group Inc | 4.14% | 1/17/2024 |
| ZION UW | Zions Bancorp NA | 4.10% | 1/23/2024 |
| RF UN | Regions Financial Corp | 4.08% | 1/19/2024 |
| TFC UN | Truist Financial Corp | 4.01% | 1/18/2024 |
| NYCB UN | New York Community Bancorp Inc | 3.97% | 1/31/2024 |
| HBAN UW | Huntington Bancshares Inc/OH | 3.96% | 1/19/2024 |
| MTB UN | M&T Bank Corp | 3.89% | 1/18/2024 |
| WAL UN | Western Alliance Bancorp | 3.83% | 1/24/2024 |
| FHN UN | First Horizon Corp | 3.66% | 1/18/2024 |
| EWBC UW | East West Bancorp Inc | 2.43% | 1/23/2024 |
Dow Jones U.S. Select Aerospace & Defense Index
| Ticker | Name | Weight in the Index | Expected Earnings Release |
| BA UN | Boeing Co/The | 19.30% | 1/25/2024 |
| RTX UN | RTX Corp | 17.09% | 1/23/2024 |
| LMT UN | Lockheed Martin Corp | 8.99% | 1/24/2024 |
| AXON UW | Axon Enterprise Inc | 4.71% | 2/28/2024 |
| LHX UN | L3Harris Technologies Inc | 4.60% | 1/26/2024 |
| GD UN | General Dynamics Corp | 4.50% | 1/25/2024 |
| TDG UN | TransDigm Group Inc | 4.47% | 2/7/2024 |
| HWM UN | Howmet Aerospace Inc | 4.44% | 2/14/2024 |
| TXT UN | Textron Inc | 4.37% | 1/24/2024 |
| NOC UN | Northrop Grumman Corp | 4.36% | 1/25/2024 |
NYSE FANG+ Index
| Ticker | Name | Weight in the Index | Expected Earnings Release |
| GOOGL UW | Alphabet Inc | 10.54% | 2/2/2024 |
| META UW | Meta Platforms Inc | 10.42% | 2/1/2024 |
| TSLA UW | Tesla Inc | 10.10% | 1/24/2024 |
| NVDA UW | NVIDIA Corp | 10.01% | 2/20/2024 |
| MSFT UW | Microsoft Corp | 10.00% | 1/24/2024 |
| NFLX UW | Netflix Inc | 9.93% | 1/23/2024 |
| SNOW UN | Snowflake Inc | 9.55% | 3/1/2024 |
Index Descriptions
- S&P 500® Index (SPXT) - Standard & Poor’s® selects the stocks comprising the S&P 500® Index (SPXT) on the basis of market capitalization, financial viability of the company and the public float, liquidity and price of a company’s shares outstanding. The Index is a float-adjusted, market capitalization-weighted index.
- S&P 500® High Beta Index (SP5HBIT) - Provided by S&P Dow Jones Indices (the "Index Provider"), which selects 100 securities to include in the Index from the S&P 500® Index that have the highest sensitivity to market movements, or “beta” over the past 12 months as determined by the Index Provider. Securities with the highest beta are generally the most volatile securities of the S&P 500® Index.
- Financial Select Sector Index (IXMTR) - Provided by S&P Dow Jones Indices and includes securities of companies from the following industries: Banks; Thrifts & Mortgage Finance; Diversified Financial Services; Consumer Finance; Capital Markets; Insurance; and Mortgage Real Estate Investment Trusts (REITs).
- Health Care Select Sector Index (IXVTR) - Provided by Standard & Poor’s and includes domestic companies from the healthcare sector, which includes the following industries: pharmaceuticals; health care equipment and supplies; health care providers and services; biotechnology; life sciences tools and services; and health care technology.
- Industrials Select Sector Index (IXITR) - Provided by S&P Dow Jones Indices and includes domestic companies from the industrials sector which includes the following industries: aerospace and defense; industrial conglomerates; marine; transportation infrastructure; machinery; road and rail; air freight and logistics; commercial services and supplies; professional services; electrical equipment; construction and engineering; trading companies and distributors; airlines; and building products.
- Real Estate Select Sector Index (IXRETR) - Provided by S&P Dow Jones Indices (the “Index Provider”) and includes securities of companies from the following industries: real estate management and development and real estate investment trusts (“REITs”), excluding mortgage REITs.
- Dow Jones Internet Composite Index (DJINETT) - Provided by S&P Dow Jones Indices and includes companies that generate at least 50% of their annual sales/revenue from the internet as determined by the Index Provider. Additionally, each stock must have a minimum of three months’ trading history and a three month average market capitalization of at least $100 million. The Index consists of 40 stocks from two different sectors, internet commerce and internet services
- S&P Biotechnology Select Industry Index (SPSIBITR) - Provided by S&P Dow Jones Indices LLC and includes domestic companies from the biotechnology industry. The Index is a modified equal – weighted index that is designed to measure the performance of the biotechnology sub-industry based on the Global Industry Classification Standards (GICS).
- NYSE Semiconductor Index (ICESEMIT) - A rules-based, modified float-adjusted market capitalization-weighted index that tracks the performance of the thirty largest U.S. listed semiconductor companies.
- Dow Jones U.S. Select Home Construction Index (DJSHMBT) - Measures U.S companies in the home construction sector that provide a wide range of products and services related to homebuilding, including home construction and producers, sellers and suppliers of building materials, furnishings and fixtures and also home improvement retailers. The Index may include large-, mid- or small-capitalization companies.
- NASDAQ 100® Equal Weighted Index (NETR) - Includes 100 of the largest non-financial securities listed on NASDAQ®, but instead of being weighted by market capitalization, each of the constituents is initially set at 1.00%.
- S&P Mid Cap 400® Index (SPTRMDCP) - Measures the performance of 400 mid-sized companies in the United States. The Index is a free-float adjusted market capitalization-weighted index composed of liquid common stocks.
- Russell 2000® Index (RU20INTR) - Measures the performance of approximately 2,000 small-capitalization companies in the Russell 3000® Index, based on a combination of their market capitalization.
- Technology Select Sector Index (IXTTR) - Provided by S&P Dow Jones Indices and includes domestic companies from the technology sector which includes the following industries: computers and peripherals; software; diversified telecommunications services; communications equipment; semiconductors and semi-conductor equipment; internet software and services; IT services; electronic equipment, instruments and components; wireless telecommunication services; and office electronics.
- Energy Select Sector Index (IXETR) - Provided by S&P Dow Jones Indices and includes domestic companies from the energy sector which includes the following industries: oil, gas and consumable fuels; and energy equipment and services.
- Utilities Select Sector Index (IXUTR) - Provided by S&P Dow Jones Indices and includes domestic companies from the utilities sector which includes the following industries: electric utilities; multi-utilities; water utilities; independent power producers and energy trades; and gas utilities.
- S&P Transportation Select Industry FMC Capped Index (SPTSCUT) - Provided by S&P Dow Jones Indices and is designed to measure stocks in the S&P Total Market Index that are included in the GICS transportation sub-industry.
- S&P Retail Select Industry Index (SPSIRETR) - A modified equal-weighted index that is designed to measure performance of the stocks comprising the S&P Total Market Index that are classified in the Global Industry Classification Standard (GICS) retail sub-industry.
- S&P Oil & Gas Exploration & Production Select Industry Index (SPSIOPTR) - Provided by Standard & Poor’s Index Provider and includes domestic companies from the oil and gas exploration and production sub industry. The Index is a modified equal weighted index that is designed to measure the performance of a sub industry or group of sub industries determined based on the Global Industry Classification Standards (GICS).
- S&P Regional Banks Select Industry Index (SPSIRBKT) - A modified equal-weighted index that is designed to measure performance of the stocks comprising the S&P Total Market Index that are classified in the Global Industry Classification Standard (GICS) regional banks sub-industry.
- Dow Jones U.S. Select Aerospace & Defense Index (DJSASDT) - Provided by Dow Jones U.S. Index (the “Index Provider”). The Index attempts to measure the performance of the aerospace and defense industry of the U.S. equity market. The Index Provider selects the stocks comprising the Index from the aerospace and defense sector on the basis of the float-adjusted, market capitalization-weight of each constituent. Aerospace companies include manufacturers, assemblers and distributors of aircraft and aircraft parts. Defense companies include producers of components and equipment for the defense industry, such as military aircraft, radar equipment and weapons.
- NYSE FANG+ Index (NYFANGT) - An equal-dollar weighted Index designed to track the performance of 10 highly-traded growth stocks of technology and tech-enabled companies. The Index is comprised of the securities of U.S.-listed companies that ICE Data Indices, LLC (the “Index Provider”) has identified as FANG+ companies, which are comprised of the six FAANMG companies and four non-FAANMG companies. The Index Provider defines the FAANMG as Meta Platforms Inc. (META), Apple Inc. (AAPL), Amazon.com Inc. (AMZN), Netflix Inc. (NFLX), Microsoft Corp. (MSFT), and Alphabet Inc. Class A (GOOGL). The Index is reconstituted quarterly.