S&P 500: Did Hot Inflation Reports Ruin the Fed’s Plans?

Editor's note: Any and all references to time frames longer than one trading day are for purposes of market context only, and not recommendations of any holding time frame. Daily rebalancing ETFs are not meant to be held unmonitored for long periods. If you don't have the resources, time or inclination to constantly monitor and manage your positions, leveraged and inverse ETFs are not for you.
After February’s Consumer Price Index (CPI)* reports showed a concerning uptick in inflationary pressures, the Fed may be reconsidering whether rate cuts are still on the table. The problem now is that stocks have spent the last few months rallying off the prospects of further liquidity. If the central bank doesn’t deliver, will there be a pullback in equity markets?
Were Earnings Enough to Drive Returns?
Markets are wrapping up what appears to be another solid earnings season from the fourth quarter of 2023. We know in the long-run, earnings growth is the primary driver of market returns, but is it enough to keep markets buoyed in the near-term?
If the equity market’s primary concern is inflation, then traders need to be on the lookout for the next CPI report, which is set to be released on April 10 for the month of March. If another hot print comes in, it may be enough to push back Fed rate cuts even further. In this scenario, stock indices could give back some of their recent gains. If stocks pull back, traders may have an opportunity with Direxion’s Daily S&P 500 Bear 3X Shares (Ticker: SPXS), which seeks daily investment results, before fees and expenses, of 300% of the inverse (or opposite) of performance of the S&P 500 Index.
Below is a daily chart of SPXS as of March 15, 2024.
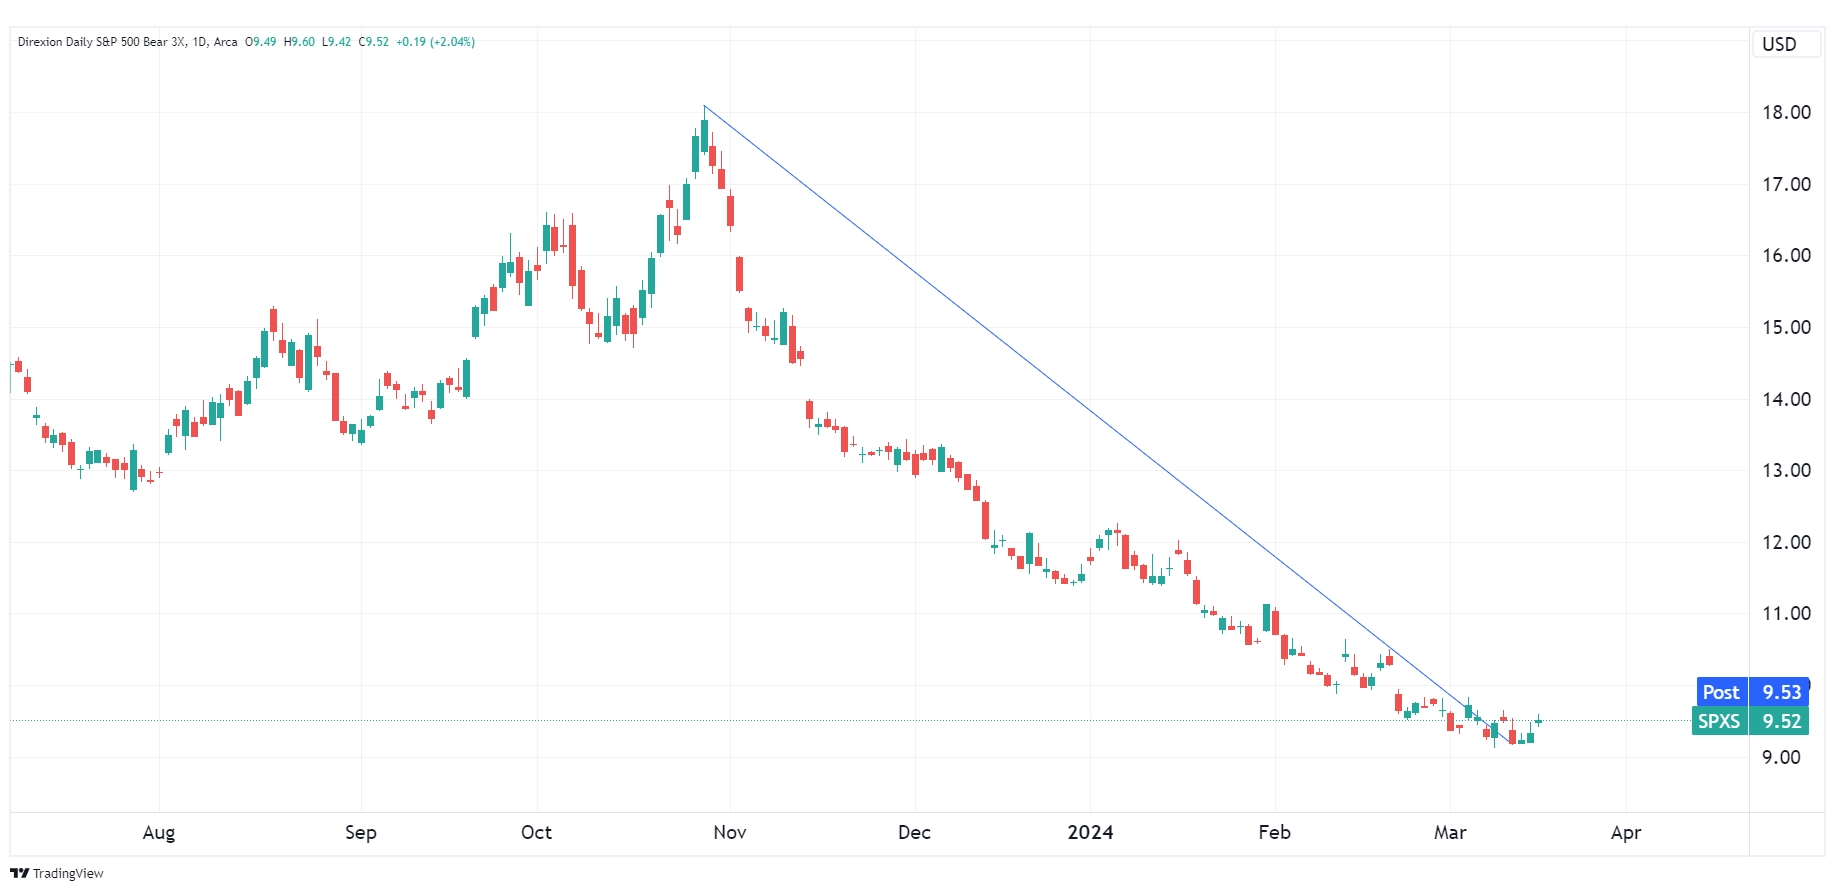
Source: TradingView.com
Candlestick charts display the high and low (the stick) and the open and close price (the body) of a security for a specific period. If the body is filled, it means the close was lower than the open. If the body is empty, it means the close was higher than the open.
The performance data quoted represents past performance. Past performance does not guarantee future results. The investment return and principal value of an investment will fluctuate. An investor’s shares, when redeemed, may be worth more or less than their original cost; current performance may be lower or higher than the performance quoted. For the most recent month-end performance go to Direxion.com/etfs. For standardized performance click here.
The slanted blue line represents a downtrend. A downtrend describes the price movement of a financial asset when the overall direction is downward.
Could Bad News Be Good News for Stocks?
The other end of the equation is the labor market, which has continued to display a general level of resiliency, exceeding the expectations of many. However, reports of layoffs and job cuts have increased in recent months, although these trends haven’t been fully reflected in labor market data yet.
The next employment report is set to be released on April 5 for the month of March. If a significant uptick in unemployment occurs, it could push the Fed to move up rate cuts and add liquidity back into the market.
In this situation, Direxion’s Daily S&P 500 Bull 3X Shares (Ticker: SPXL), which seeks daily investment results, before fees and expenses, of 300% of the performance of the S&P 500 Index, could see a strong rally.
Since consumption accounts for roughly 70% of the U.S. economy, an uptick in unemployment could be a prelude to a recession, as it could lead to a significant reduction in demand. This may only be temporary, however, especially if the Fed pivots.
Below is a daily chart of SPXL as of March 15, 2024.
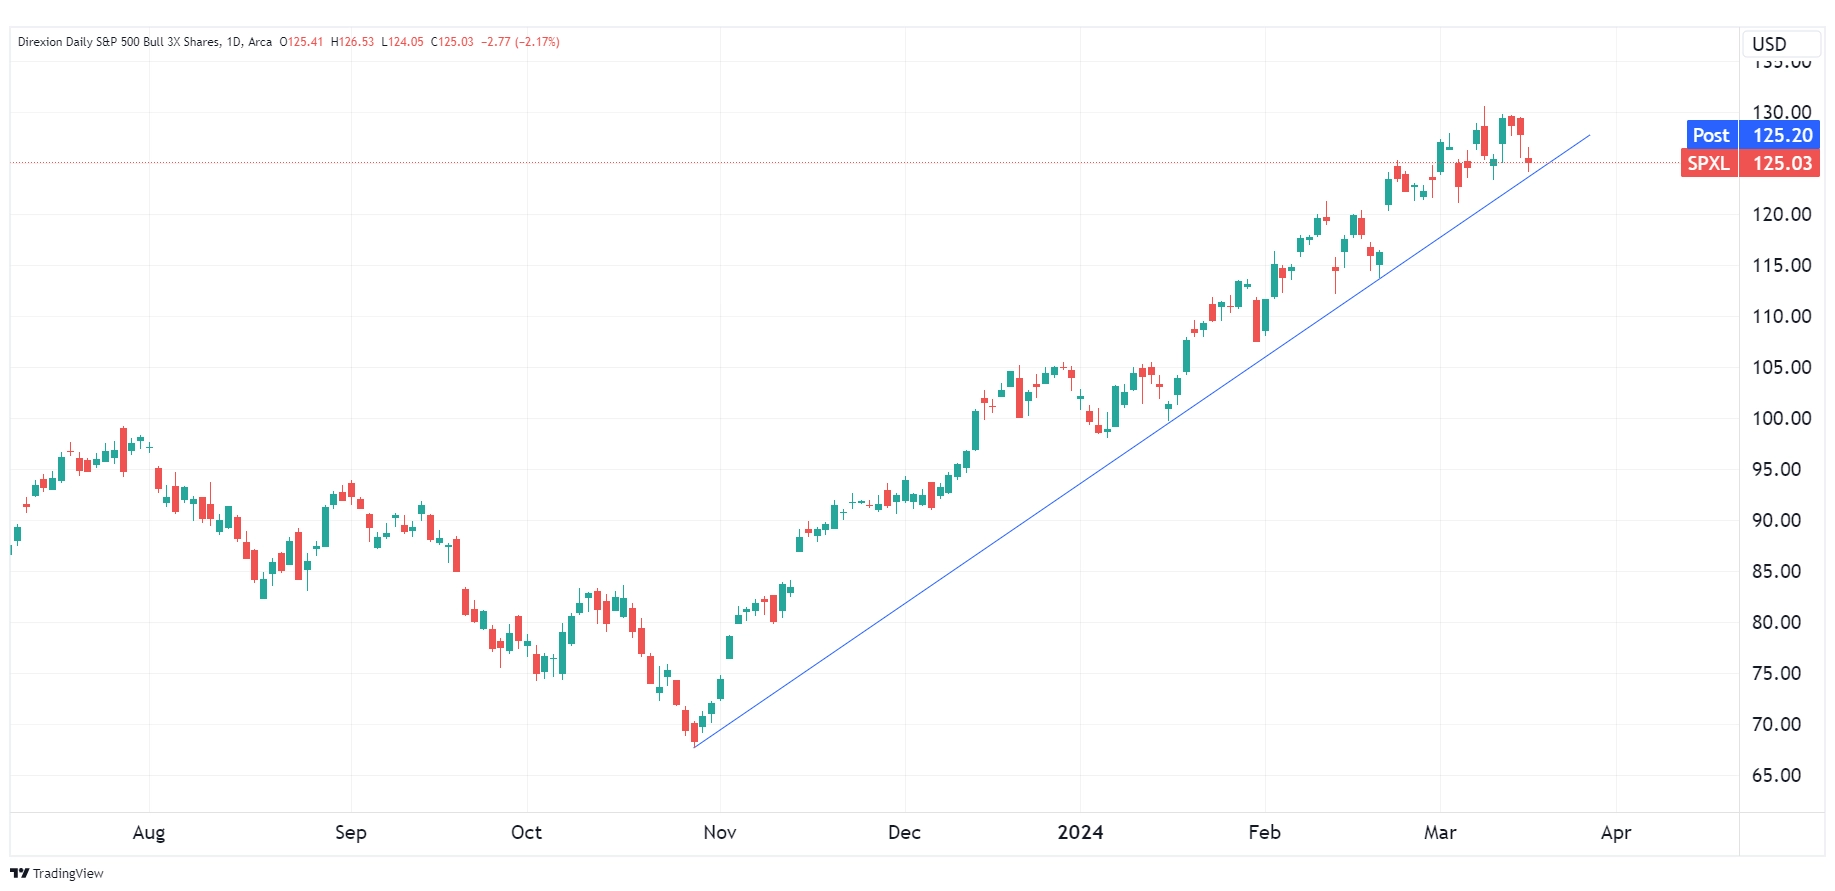
Source: TradingView.com
Candlestick charts display the high and low (the stick) and the open and close price (the body) of a security for a specific period. If the body is filled, it means the close was lower than the open. If the body is empty, it means the close was higher than the open.
The performance data quoted represents past performance. Past performance does not guarantee future results. The investment return and principal value of an investment will fluctuate. An investor’s shares, when redeemed, may be worth more or less than their original cost; current performance may be lower or higher than the performance quoted. For the most recent month-end performance go to Direxion.com/etfs. For standardized performance click here.
The slanted blue line represents an uptrend. An uptrend describes the price movement of a financial asset when the overall direction is upward.
*Definitions and Index Descriptions
An investor should carefully consider a Fund’s investment objective, risks, charges, and expenses before investing. A Fund’s prospectus and summary prospectus contain this and other information about the Direxion Shares. To obtain a Fund’s prospectus and summary prospectus call 866-476-7523 or visit our website at direxion.com. A Fund’s prospectus and summary prospectus should be read carefully before investing.
Leveraged and Inverse ETFs pursue daily leveraged investment objectives which means they are riskier than alternatives which do not use leverage. They seek daily goals and should not be expected to track the underlying index over periods longer than one day. They are not suitable for all investors and should be utilized only by sophisticated investors who understand leverage risk and who actively manage their investments.
The S&P 500® Index (SPXT) is designed to be comprised of stocks that are the 500 leading, large-cap U.S. listed issuers. The securities are selected on the basis of market capitalization, financial viability of the company, sector representation, public float, liquidity and price of a company’s shares outstanding. The Index is a float-adjusted, market capitalization-weighted index. One cannot directly invest in an index.
The “S&P 500 Index” is a product of S&P Dow Jones Indices LLC (“SPDJI”), and has been licensed for use by Rafferty Asset Management, LLC (“Rafferty”). Standard & Poor’s® and S&P® are registered trademarks of Standard & Poor’s Financial Services LLC (“S&P”); Dow Jones® is a registered trademark of Dow Jones Trademark Holdings LLC (“Dow Jones”); and these trademarks have been licensed for use by SPDJI and sublicensed for certain purposes by Rafferty. Rafferty’s ETFs are not sponsored, endorsed, sold or promoted by SPDJI, Dow Jones, S&P, their respective affiliates and none of such parties make any representation regarding the advisability of investing in such product(s) nor do they have any liability for any errors, omissions, or interruptions of the S&P 500® Index.
Direxion Shares Risks — An investment in each Fund involves risk, including the possible loss of principal. Each Fund is non-diversified and includes risks associated with the Funds’ concentrating their investments in a particular industry, sector, or geographic region which can result in increased volatility. The use of derivatives such as futures contracts and swaps are subject to market risks that may cause their price to fluctuate over time. Risks of each Fund include Effects of Compounding and Market Volatility Risk, Leverage Risk, Market Risk, Counterparty Risk, Rebalancing Risk, Intra-Day Investment Risk, Other Investment Companies (including ETFs) Risk, Cash Transaction Risk, Tax Risk, and risks specific to the securities that comprise the S&P 500® Index. Additional risks include, for the Direxion Daily S&P 500® Bull 3X Shares, Daily Index Correlation Risk and for the Direxion Daily S&P 500® Bear 3X Shares, Daily Inverse Index Correlation Risk, and risks related to Shorting. Please see the summary and full prospectuses for a more complete description of these and other risks of each Fund.
Distributor: Foreside Fund Services, LLC.