Will Small-Caps Make the Big Time?
Editor's note: Any and all references to time frames longer than one trading day are for purposes of market context only, and not recommendations of any holding time frame. Daily rebalancing ETFs are not meant to be held unmonitored for long periods. If you don't have the resources, time or inclination to constantly monitor and manage your positions, leveraged and inverse ETFs are not for you.
Compared to its large-cap* or mid-cap* peers, the small-cap* sector, as tracked by the Russell 2000 Index, has struggled on a relative basis over the past couple of years. In fact, the index has yet to return to its all-time highs from November 2021, prompting some concerns over the state of the economy. Are these fears justified or perhaps even a countersignal with respect to sentiment?
Are Small Caps Cheap for a Reason?
As equity markets come down from their all-time highs, the Russell 2000 may offer some appeal to those shopping for value. On the other hand, the market could be pricing in some difficulties for smaller companies due to the macroeconomic environment.
Markets were anticipating numerous rate cuts from the Federal Reserve during 2024. But, after a series of stronger-than-expected jobs reports and hotter-than-expected inflation readings, the number has dropped to only two, although even that estimate could change.
Traders would be wise to keep a close eye on the next employment report and Consumer Price Index (CPI)* inflation report set to be released on May 3 and May 15, respectively. If these continue to exceed estimates, it could continue to push back rate cut odds, and further problems for the small cap sector.
Traders that think there’s still more downside in the small cap space may find a trade with Direxion’s Daily Small Cap Bear 3X Shares (Ticker: TZA), which seeks daily investment results, before fees and expenses, of -300% of the performance of the Russell 2000 Index.
Below is a daily chart of TZA as of April 18, 2024.
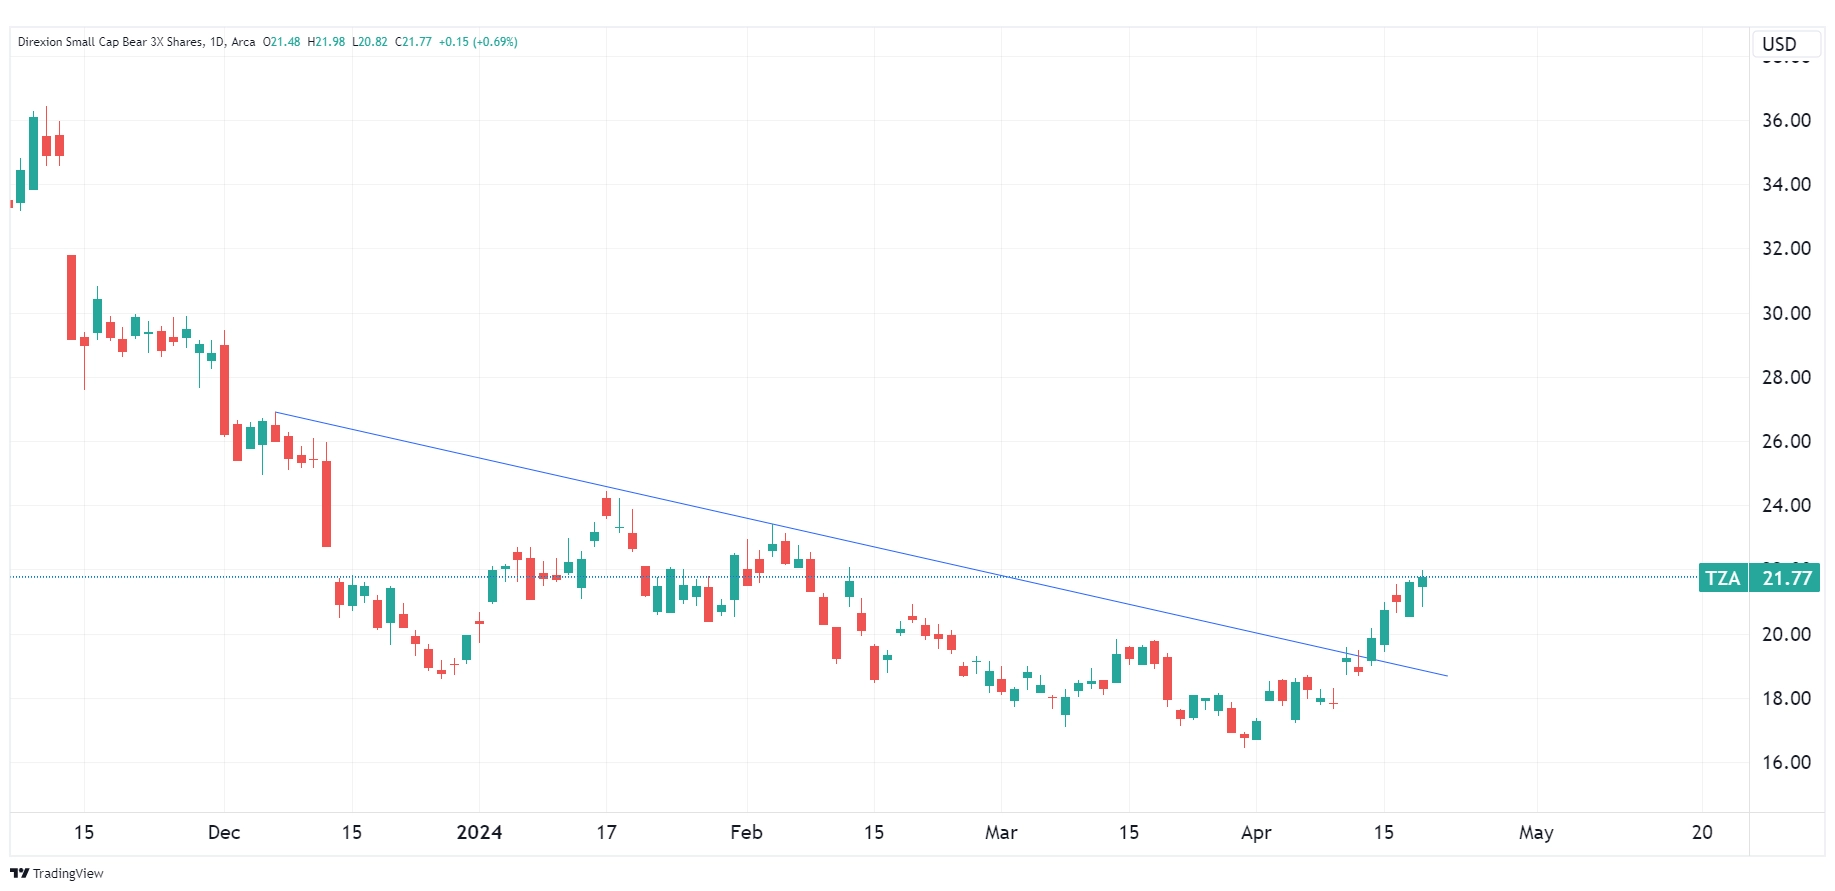
Source: TradingView.com
Candlestick charts display the high and low (the stick) and the open and close price (the body) of a security for a specific period. If the body is filled, it means the close was lower than the open. If the body is empty, it means the close was higher than the open.
The performance data quoted represents past performance. Past performance does not guarantee future results. The investment return and principal value of an investment will fluctuate. An investor’s shares, when redeemed, may be worth more or less than their original cost; current performance may be lower or higher than the performance quoted. For the most recent month-end performance go to Direxion.com/etfs. For standardized performance click here.
The slanted blue line represents a downtrend. A downtrend describes the price movement of a financial asset when the overall direction is downward.
Could an Earnings Surprise Catalyze Small Caps?
With the first quarter’s earnings results just around the corner, traders seeking to take a bit more optimistic route with respect to small caps should be on the lookout for some upside surprises or strong guidance issued by small cap companies. After all, if the economy is outperforming as the data implies, it could translate into stronger earnings results.
Direxion’s Daily Small Cap Bull 3X Shares (Ticker: TNA), which seeks daily investment results, before fees and expenses, of 300% of the performance of the Russell 2000 Index, could be a major beneficiary in such a situation.
The fund’s top-holdings include names like Super Micro Computer (Ticker: SMCI), Microstrategy (Ticker: MSTR), and Comfort Systems USA (Ticker: FIX). FIX reported its earnings results on April 25 and MSTR reported on April 29, whereas SMCI reports next on May 7. A beat by any of these companies could be sufficient to propel TNA higher.
To view the Fund's full holdings, click here. Holdings are subject to risk and change.
Below is a daily chart of TNA as of April 18, 2024.
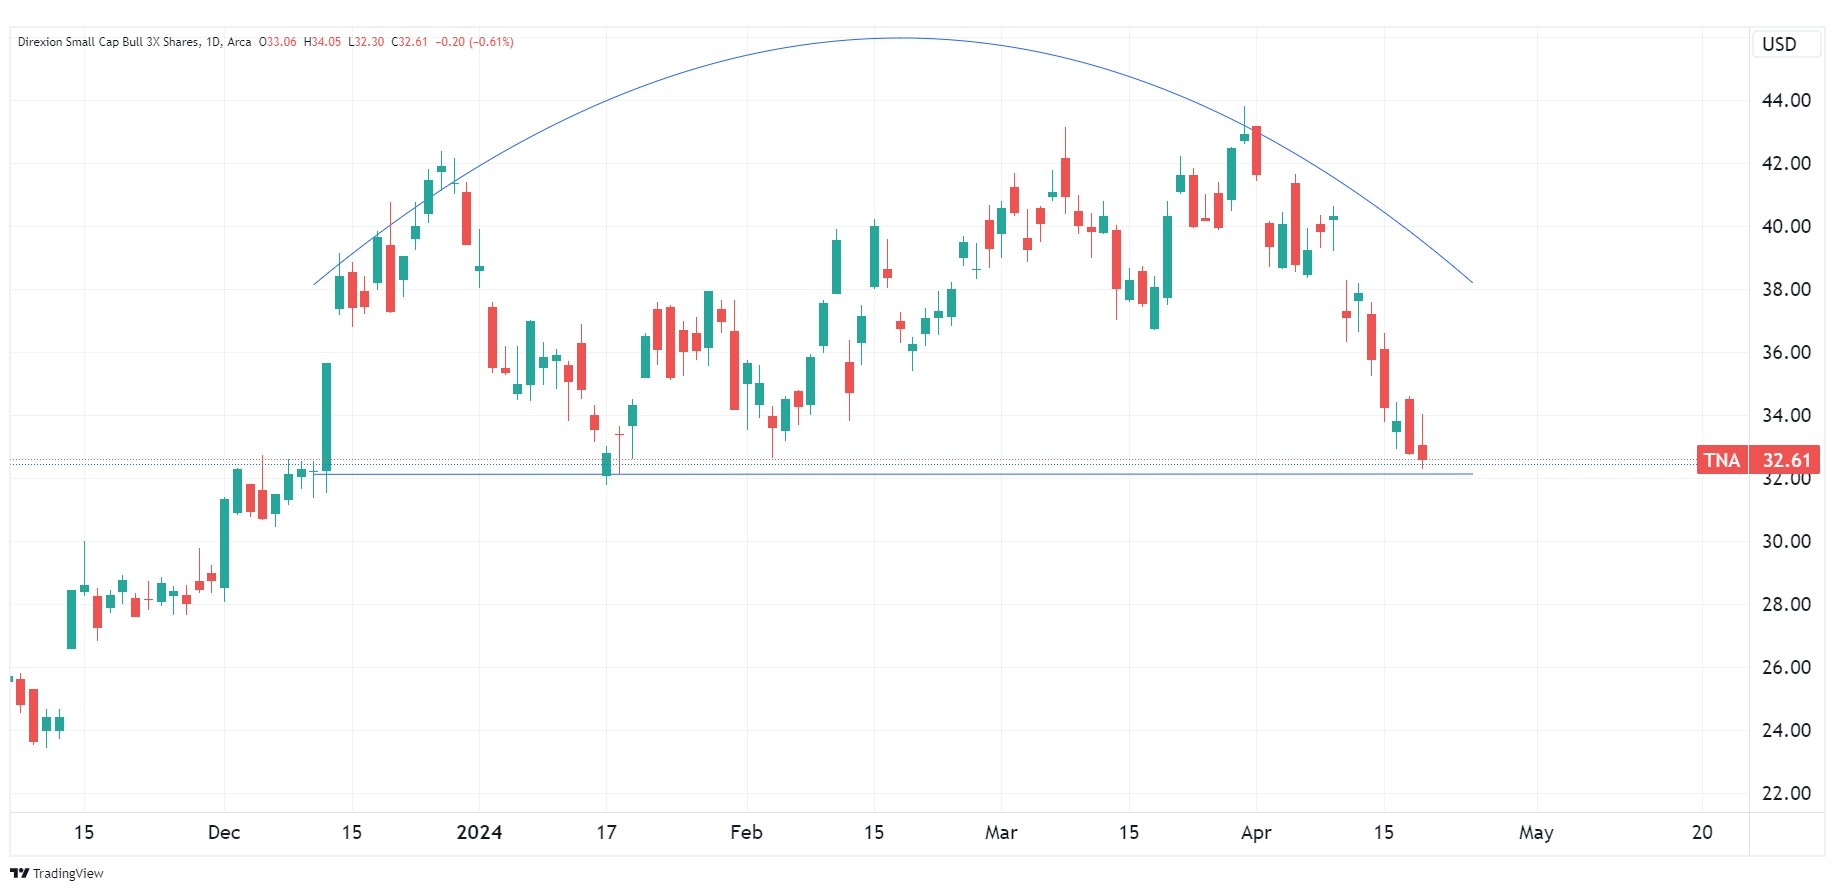
Source: TradingView.com
Candlestick charts display the high and low (the stick) and the open and close price (the body) of a security for a specific period. If the body is filled, it means the close was lower than the open. If the body is empty, it means the close was higher than the open.
The performance data quoted represents past performance. Past performance does not guarantee future results. The investment return and principal value of an investment will fluctuate. An investor’s shares, when redeemed, may be worth more or less than their original cost; current performance may be lower or higher than the performance quoted. For the most recent month-end performance go to Direxion.com/etfs. For standardized performance click here.
Various Market Cap Opportunities
For traders looking for a play in large caps, Direxion offers the Direxion Daily S&P 500 Bull 3X Shares (Ticker: SPXL) and the Direxion Daily S&P 500 Bear 3X Shares (Ticker: SPXS), which seek daily investment results, before fees and expenses, of 300%, or -300%, respectively, of the performance of the S&P 500® Index*.
Direxion has also blazed ETF trails with innovative Single Stock Leveraged & Inverse ETFs that track names like Apple, Nvidia, Google, Amazon, and more. Investing in the single stock ETFs is not the same as investing directly in the respective underlying security.
The Direxion Daily AAPL Bull 2X Shares (Ticker: AAPU) seeks daily investment results, before fees and expenses, of 200% of the performance of Apple Inc. common stock, while the Direxion Daily AAPL Bear 1X Shares (Ticker: AAPD) seeks daily investment results, before fees and expenses, of 100% of the inverse (or opposite) of the performance of Apple Inc. common stock.
The Direxion Daily NVDA Bull 2X Shares (Ticker: NVDU) seeks daily investment results, before fees and expenses, of 200% of the performance of NVIDIA Corporation common stock, while the Direxion Daily NVDA Bear 1X Shares (Ticker: NVDD) seeks daily investment results, before fees and expenses, of 100% of the inverse (or opposite) of the performance of NVIDIA Corporation common stock.
The Direxion Daily AMZN Bull 2X Shares (Ticker: AMZU) seeks daily investment results, before fees and expenses, of 200% of the performance of Amazon.com, Inc. common stock, while the Direxion Daily AMZN Bear 1X Shares (Ticker: AMZD) seeks daily investment results, before fees and expenses, of 100% of the inverse (or opposite) of the performance of Amazon.com, Inc. common stock.
The Direxion Daily GOOGL Bull 2X Shares (Ticker: GGLL) seeks daily investment results, before fees and expenses, of 200% of the performance of the Class A shares of Alphabet Inc. common stock, while the Direxion Daily GOOGL Bear 1X Shares (Ticker: GGLS) seeks daily investment results, before fees and expenses, of 100% of the inverse (or opposite) of the performance of the Class A shares of Alphabet Inc. common stock.
*Definitions and Index Descriptions
An investor should carefully consider a Fund’s investment objective, risks, charges, and expenses before investing. A Fund’s prospectus and summary prospectus contain this and other information about the Direxion Shares. To obtain a Fund’s prospectus and summary prospectus call 866-476-7523 or visit our website at direxion.com. A Fund’s prospectus and summary prospectus should be read carefully before investing.
Leveraged and Inverse ETFs pursue daily leveraged investment objectives which means they are riskier than alternatives which do not use leverage. They seek daily goals and should not be expected to track the underlying index over periods longer than one day. They are not suitable for all investors and should be utilized only by sophisticated investors who understand leverage risk and who actively manage their investments.
The Russell 2000® Index (RU20INTR) measures the performance of approximately 2,000 small-capitalization companies in the Russell 3000® Index, based on a combination of their market capitalization.
The S&P 500® Index (SPXT) is designed to be comprised of stocks that are the 500 leading, large-cap U.S. listed issuers. The securities are selected on the basis of market capitalization, financial viability of the company, sector representation, public float, liquidity and price of a company’s shares outstanding. The Index is a float-adjusted, market capitalization-weighted index.
One cannot directly invest in an index.
The Russell 2000® Index is a trademark of Frank Russell Company (“Russell”) and has been licensed for use by the Trust. The Direxion Daily Small Cap Bull and Bear 3X Shares are not sponsored, endorsed, sold or promoted by Russell. Russell makes no representation regarding the advisability of investing in the Direxion Daily Small Cap Bull and Bear 3X Shares.
The “S&P 500 Index" is a product of S&P Dow Jones Indices LLC ("SPDJI"), and has been licensed for use by Rafferty Asset Management, LLC ("Rafferty"). Standard & Poor’s® and S&P® are registered trademarks of Standard & Poor’s Financial Services LLC ("S&P"); Dow Jones® is a registered trademark of Dow Jones Trademark Holdings LLC ("Dow Jones"); and these trademarks have been licensed for use by SPDJI and sublicensed for certain purposes by Rafferty. Rafferty’s ETFs are not sponsored, endorsed, sold or promoted by SPDJI, Dow Jones, S&P, their respective affiliates and none of such parties make any representation regarding the advisability of investing in such product(s) nor do they have any liability for any errors, omissions, or interruptions of the S&P 500® Index.
Direxion Shares Risks — An investment in each Fund involves risk, including the possible loss of principal. Each Fund is non-diversified and includes risks associated with the Funds’ concentrating their investments in a particular industry, sector, or geographic region which can result in increased volatility. The use of derivatives such as futures contracts and swaps are subject to market risks that may cause their price to fluctuate over time. Risks of each Fund include Effects of Compounding and Market Volatility Risk, Leverage Risk, Market Risk, Counterparty Risk, Rebalancing Risk, Intra-Day Investment Risk, Other Investment Companies (including ETFs) Risk, Cash Transaction Risk, Passive Investment and Index Performance Risk, and risks specific to investment in micro-cap, small- and/or mid-capitalization securities. Investing in micro-capitalization companies are significantly more volatile as they face greater risk of business failure than companies considered small and/or mid-capitalization companies. Investing in small and/or mid-capitalization securities involves greater risks and the possibility of greater price volatility than investing in larger, more-established companies. Additional risks include, for the Direxion Daily Small Cap Bull 3X Shares, Daily Index Correlation Risk, and for the Direxion Daily Small Cap Bear 3X Shares, Shorting or Inverse Risk and Daily Inverse Index Correlation Risk. Please see the summary and full prospectuses for a more complete description of these and other risks of each Fund.
Distributor: Foreside Fund Services, LLC.