Direxion Hydrogen ETF
The Direxion Hydrogen ETF seeks investment results, before fees and expenses, that track the Indxx Hydrogen Economy Index. There is no guarantee that the fund will achieve its stated investment objective.
HJEN
Operational Updates
- 06/21/2024
Direxion to Close 3 Funds, Including HJEN
Read Press Release - 01/23/2024
Direxion's New ETF Alert Service. Get Price and Volume Alerts automatically via text message!
Set Up Your ETF Alerts Today
Documents & Downloads
The Direxion Hydrogen ETF offers exposure to 30 companies leading the way towards net-zero emissions by providing more accessible, efficient, sustainable solutions across the following five hydrogen-related sub-themes. HJEN may be considered a satellite holding to complement other broader positions within a portfolio.
- Hydrogen Production and Generation: Companies involved in the process of hydrogen generation, in either liquid or solid form.
- Hydrogen Storage and Supply: Companies engaged in providing storage and transportation services of hydrogen. It also includes companies that supply hydrogen to various users and operate hydrogen fueling stations across countries.
- Fuel Cell and Battery: Companies manufacturing fuel cells and batteries that are run on hydrogen-based technology.
- Hydrogen Systems and Solutions: Companies offering equipment, components or technology used in hydrogen industry. Those involved in providing solutions and systems to the value chain across hydrogen generation, storage and supply.
- Membrane and Catalyst: Companies that design and produce membrane, filters, catalyst or membrane assemblies for fuel cell, or hydrogen-related, technologies.
Pricing & Performance
NAV and Market Price information as of 07/19/2024.
Net Asset Value (NAV)
Market Price Closing
| 1M | 3M | YTD | 1Y | 3Y | 5Y | 10Y | Since Inception | Expense Ratio* (Gross / Net%) | Inception Date | |
|---|---|---|---|---|---|---|---|---|---|---|
| HJEN NAV | -15.31 | -2.13 | -11.48 | -18.64 | -22.05 | — | — | -22.03 | 0.45 / 0.45* | 03/25/2021 |
| HJEN Market Close | -16.33 | -3.79 | -12.77 | -19.48 | -22.21 | — | — | -22.16 | 0.45 / 0.45* | 03/25/2021 |
As of June 30, 2024
The Primary Listing Exchange is the NYSE Arca, Inc.
*The Fund’s adviser, Rafferty Asset Management, LLC (“Rafferty”) has entered into an Operating Services Agreement with the Fund. Under this Operating Services Agreement, Rafferty has contractually agreed to pay all expenses of the Fund as long as it is the advisor of the Fund other than the following: management fees, Rule 12b-1 distribution and/or service fees, taxes, swap financing and related costs, dividends or interest on short positions, other interest expenses, brokerage commissions, expenses incurred in connection with any merger or reorganization, acquired fund fees and expenses, and extraordinary expenses. If these expenses were included, the expense ratio would be higher.
The performance data quoted represents past performance. Past performance does not guarantee future results. The investment return and principal value of an investment will fluctuate. An investor’s shares, when redeemed, may be worth more or less than their original cost. Current performance may be lower or higher than the performance quoted. Returns for performance under one year are cumulative, not annualized. For the most recent month-end performance please visit the fund’s website at direxion.com.
Short-term performance, in particular, is not a good indication of the fund’s future performance, and an investment should not be made based solely on returns. Because of ongoing market volatility, fund performance may be subject to substantial short-term changes. For additional information, see the fund’s prospectus.
Index Information
The Hydrogen Economy Index (1H2ECO) tracks the performance of companies that provide goods and/or services related to the hydrogen industry, including hydrogen generation and storage, transportation and supply of hydrogen, fuel cells, and hydrogen fueling stations. The Index includes domestic securities as well as securities listed on various foreign markets, including among others, Japan and South Korea. The Index will be reconstituted annually and rebalanced quarterly. One cannot invest directly in an index.
Index Top Ten Holdings
| % of Total | |
|---|---|
| Bloom Energy Corporation | 9.89% |
| Nel ASA | 9.34% |
| Air Liquide | 7.16% |
| Plug Power | 7.05% |
| Ballard Power Systems | 6.57% |
| Doosan Fuel Cell Company Ltd | 4.75% |
| Eneos Holdings Inc | 4.68% |
| Air Products And Chemicals | 4.66% |
| Sinopec Corporation H | 4.66% |
| Shell Plc Rpstg 2 A | 4.22% |
Index Country Weightings
| % of Total | |
|---|---|
| United States | 25.48% |
| United Kingdom | 20.45% |
| Japan | 12.08% |
| Norway | 11.05% |
| Korea | 7.37% |
| France | 7.16% |
| Canada | 6.57% |
| China | 5.13% |
| Sweden | 2.19% |
| Taiwan | 1.17% |
| Germany | 0.98% |
| Thailand | 0.38% |
Hydrogen is a Versatile Source of Clean Energy with Multiple Applications
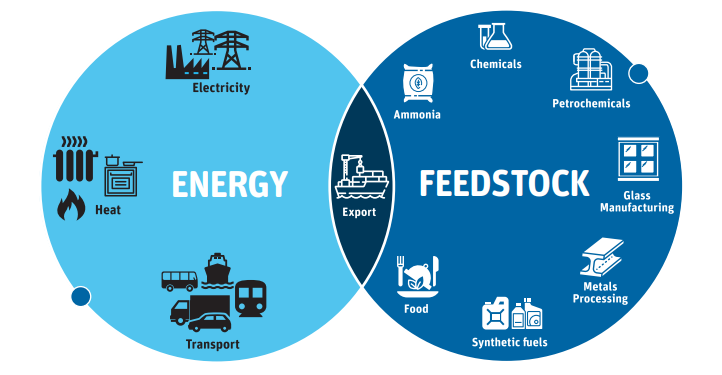
Source: Australia’s Commonwealth Scientific and Industrial Research Organisation (CSIRO): National Hydrogen Roadmap (2019)
Distributions
| Record Date | Ex Date | Pay Date | Income Dividend | Short-Term Capital Gain | Long-Term Capital Gain | Expand |
|---|---|---|---|---|---|---|
| 06/25/2024 | 06/25/2024 | 07/02/2024 | 0.08017 | — | — | |
| 03/20/2024 | 03/19/2024 | 03/26/2024 | 0.01811 | — | — | |
| 12/22/2023 | 12/21/2023 | 12/29/2023 | 0.04550 | — | — | |
| 09/20/2023 | 09/19/2023 | 09/26/2023 | 0.04144 | — | — | |
Record Date06/25/2024 Ex Date06/25/2024 Pay Date07/02/2024 Income Dividend0.08017 Short-Term Capital Gain— Long-Term Capital Gain— Record Date03/20/2024 Ex Date03/19/2024 Pay Date03/26/2024 Income Dividend0.01811 Short-Term Capital Gain— Long-Term Capital Gain— Record Date12/22/2023 Ex Date12/21/2023 Pay Date12/29/2023 Income Dividend0.04550 Short-Term Capital Gain— Long-Term Capital Gain— Record Date09/20/2023 Ex Date09/19/2023 Pay Date09/26/2023 Income Dividend0.04144 Short-Term Capital Gain— Long-Term Capital Gain— | ||||||
Documents
How to Buy
ETFs are generally available for purchase on exchanges, much like stocks—and can be bought and sold throughout the trading day whenever exchanges are open. Direxion ETFs cannot be purchased directly from Direxion, but are available for trading on most trading platforms.
We strongly recommend that you take the time to educate yourself on how ETFs function and behave in various market conditions before you endeavor to trade them in your account. It’s always a good idea to consult a financial advisor or brokerage account representative if you have questions about any ETFs.
Please note, your advisor or broker may charge commissions or other transaction fees. If you have any questions specific to Direxion products, please contact us direct at [email protected] or 866-476-7523.
Operational Updates
- 06/21/2024
Direxion to Close 3 Funds, Including HJEN
Read Press Release - 01/23/2024
Direxion's New ETF Alert Service. Get Price and Volume Alerts automatically via text message!
Set Up Your ETF Alerts Today
Documents & Downloads
How to Buy
While you can't purchase our funds from our website, investors still have multiple options for buying Direxion ETFs.
Learn More About Buying Direxion ETFs
Subscribe to Newsletters & Operational Updates
Sign up for email and/or text of the important news, including:
- Fund updates including splits, distributions, launches, and other corporate actions
- Educational events, such as web seminars and conferences
- Our latest research and industry trends
Learn about Non-Leveraged ETFs
We have a wealth of articles and educational resources to provide investors with insights into economic and market events related to help inform your longer-term ETF investing.

The Spotlight Newsletter

Commodities COMmentary