Is Equal Weighting the Next Growth Strategy?

The largest constituents in the S&P 500® Index tend to represent a significant portion of its total return profile, while the largest constituents in the NASDAQ-100® Index deliver an even higher percentage of the index’s total return given its smaller basket. Usually, this concentration is a good thing, as big names such as Microsoft, Apple, and Amazon deliver strong returns, but in 2022, not so much. In fact, both Microsoft and Apple were down nearly 30% in 2022, but remained the top two holdings in both the NASDAQ-100® Index and S&P 500® Index, with over 10% and over 5% weight, respectively.
In order to navigate market environments like those of 2022, investors may want to consider transforming their exposure away from a traditional cap weighted* approach to an equal weighted* one so as to maintain all of the same names, but with a balanced allocation to each component.
What We’ve Seen
- 2022 moved away from mega cap outperformance. Heavily weighted names like Apple, Microsoft, and Meta actually brought down the returns on many portfolios. Thus, the equal weighted NASDAQ-100® index pulled ahead performance-wise.
- Equal weighted approaches, of any kind, may see a potential increase in risk coming from greater exposure to the historically more volatile, smaller names, but that has not been the experience with the NASDAQ-100® Index. While the average weighted market cap is reduced by 18.9% using an equal weighted approach, the average 30 day volatility for both a cap weighted and an equal weighted approach over the last 10 years has been within 0.95% of each other.
Equal Weighted Outperformed Cap Weighted NASDAQ-100 Index in 2022
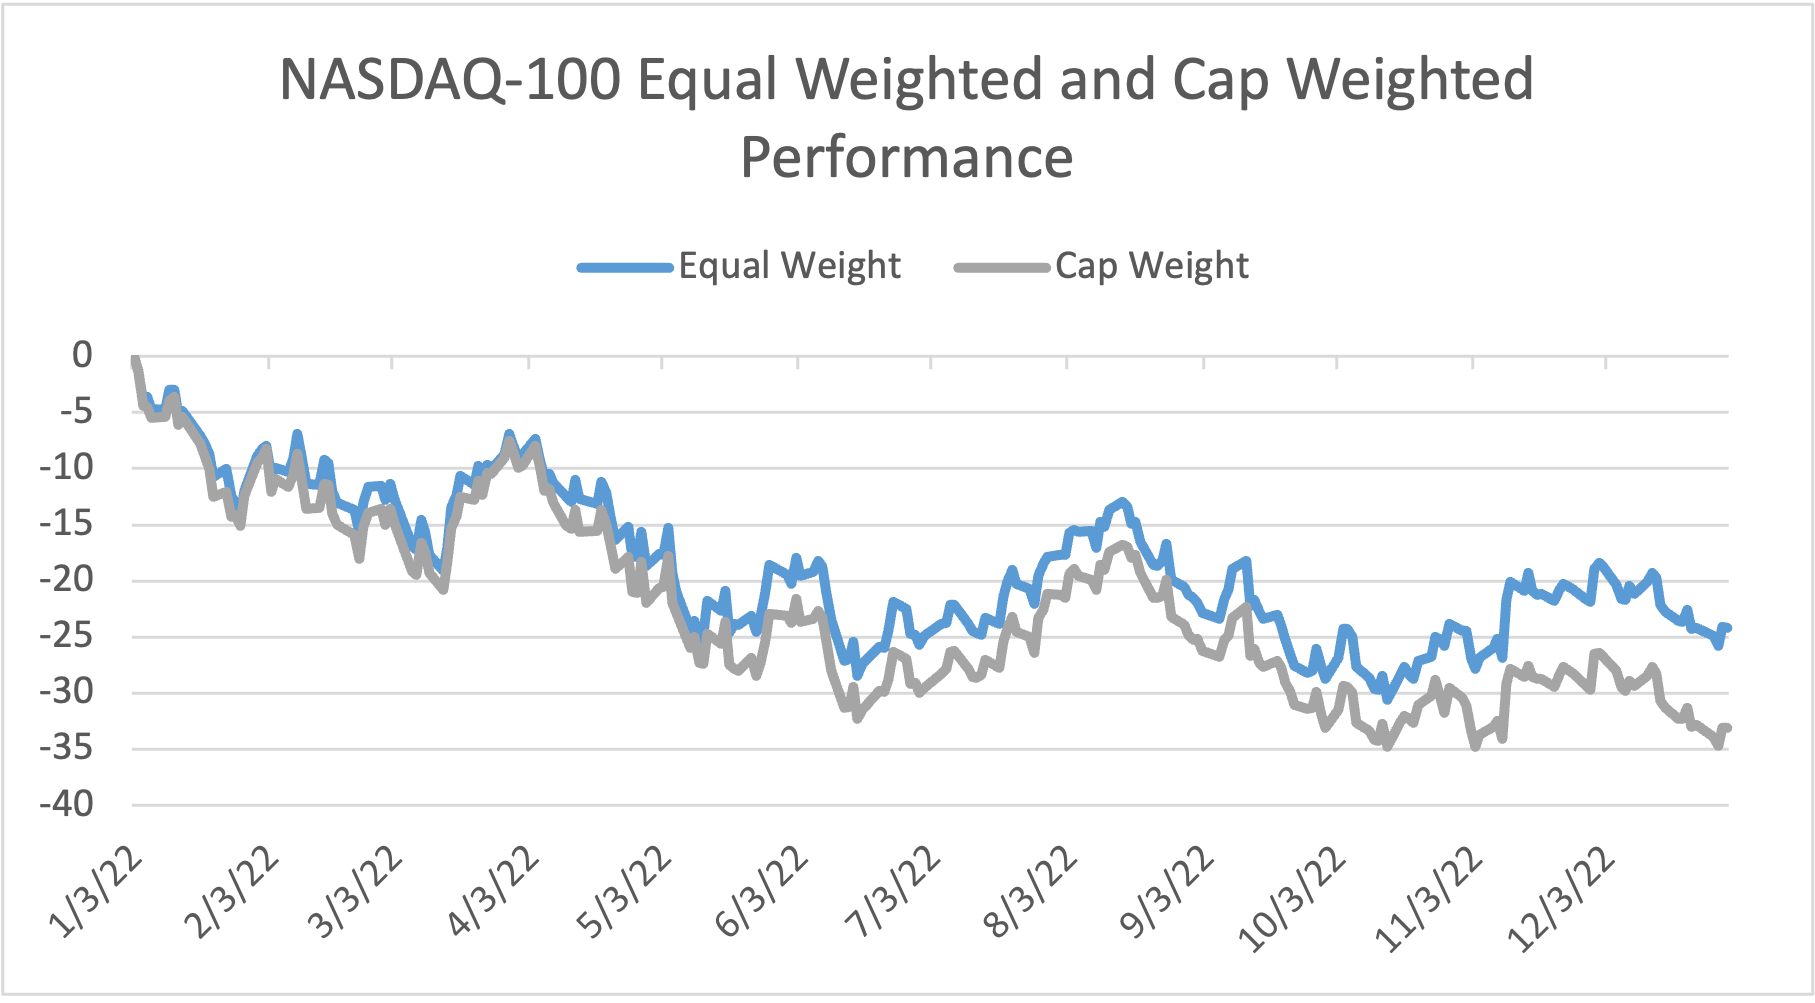
Source: NASDAQ, as of December 31, 2022. Past performance is not indicative of future results. One cannot invest directly in an index.
Money in Motion
- Despite poor returns to the index, in 2022, investors added $6.36 billion to non-leveraged and inverse NASDAQ-100® Index-related ETFs, demonstrating a continued interest in the space. The year was off to a rough start, with $5.2 billion of outflows in January alone as the index fell 8.5%. To counteract these outflows, March posted its first positive returns of the year and saw $9.2 billion of inflows.
- Flows in the second half of the year were slightly more muted, even as the NASDAQ-100® index continued to move sporadically. The year ended much like it began, with the index down 9% in December and $2.2 billion in outflows for related products.
Flows Followed Performance Directionally for Much of 2022
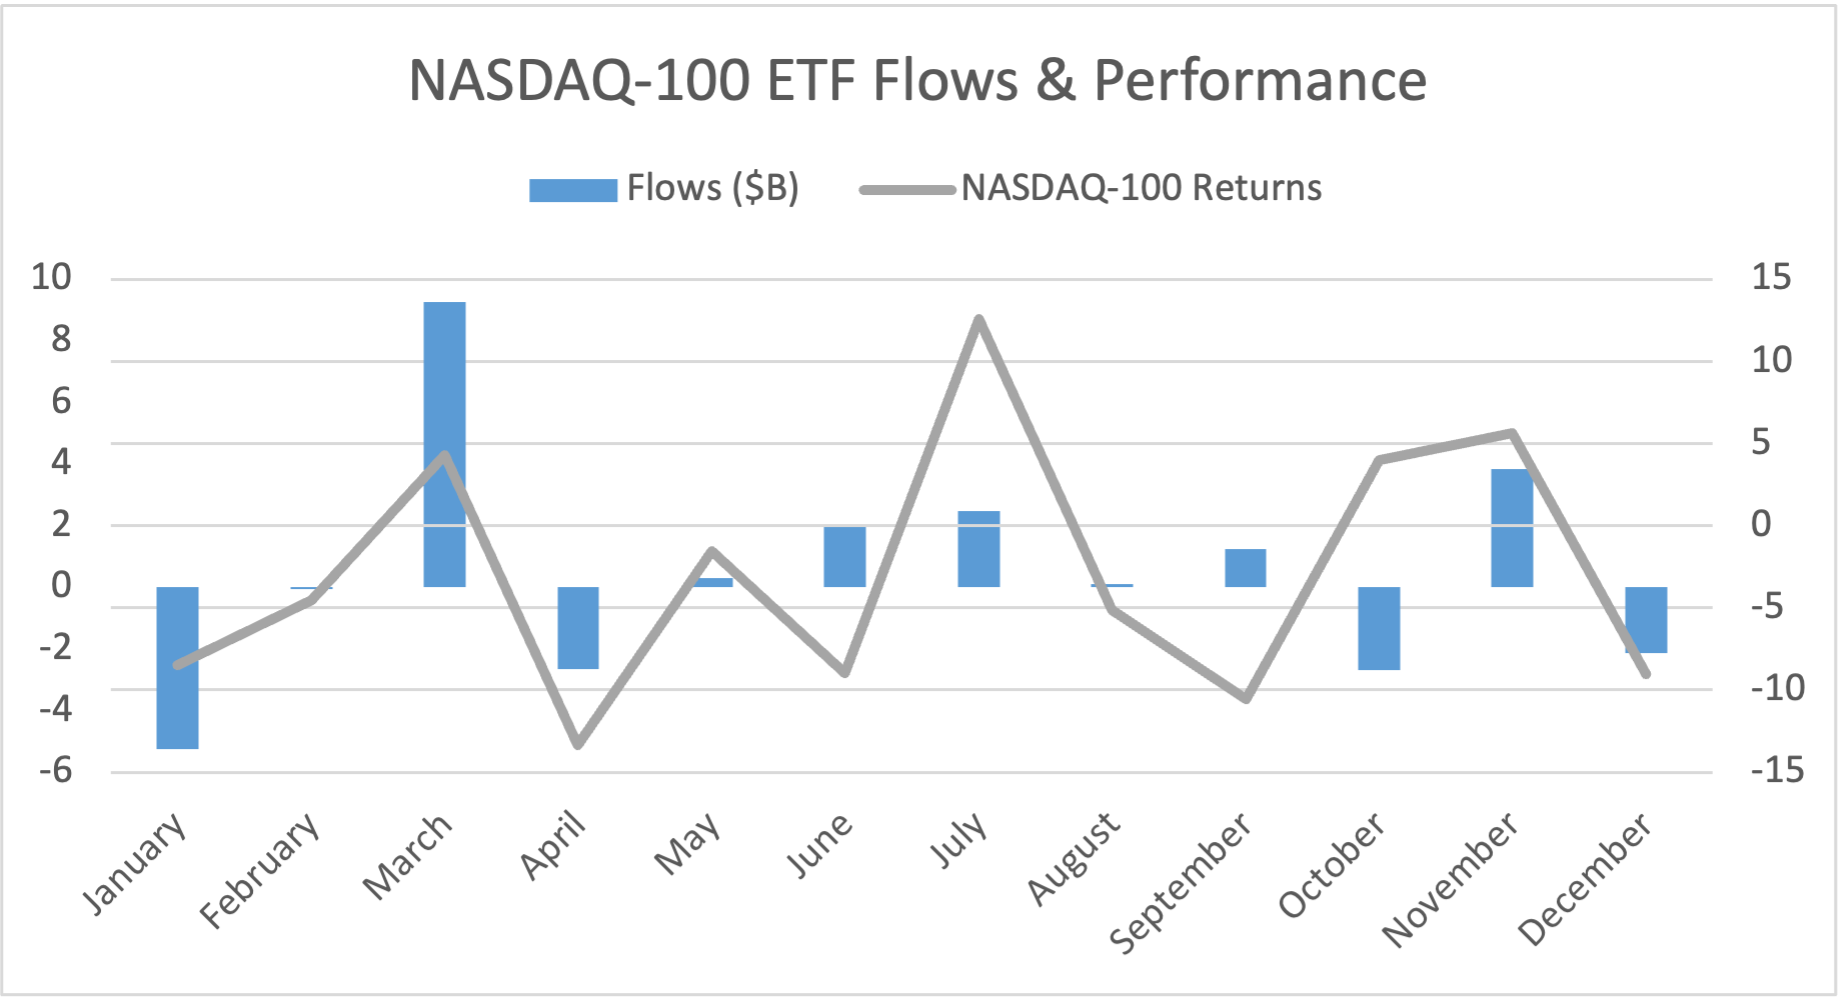
Source: NASDAQ, as of December 31, 2022. Data represents the monthly net flows of U.S.-listed non-leveraged and inverse NASDAQ-100 related ETFs and the total returns of the NASDAQ-100. Past performance is not indicative of future returns. One cannot invest directly in an index.
What’s Next?
With the top ten holdings representing over 50% of the index, the NASDAQ-100® Index is considerably top-heavy as mega caps dominate. Although this approach may benefit investors some years, they may suffer on a relative basis when these names pull back, as seen in 2022, making an equal weighted approach attractive to investors who may want to maintain the same name exposure, but in a more balanced, diversified way.
- This more balanced exposure, while most apparent at the cap level, also applies at the sector level, with Information Technology maintaining the highest weight, but moving to under 40% from 50%. Communication services comes down from 16% to 10%, with health care and industrials seeing the largest increases. Interestingly, the weighted average market cap moves from $694 billion to $132 billion, so the exposure remains decidedly large cap, but no longer extremely mega cap.
- As markets continue to navigate unpredictable conditions, where mega cap technology names are not consistently leading performance, an equal weighted approach may be a prudent means of maintaining a high level of exposure to tech and tech-related sectors, but diversifying the influence each name plays in total returns.
An Equal Weighted Approach Sees More Balanced Exposures
| NASDAQ-100 Top 10 Holdings | NASDAQ-100 (%) | NASDAQ-100 Equal Weighted (%) | Difference (%) |
|---|---|---|---|
| Microsoft Corporation | 12.59 | 1.00 | -11.59 |
| Apple Inc. | 11.76 | 0.98 | -10.78 |
| Amazon.com Inc. | 6.06 | 0.97 | -5.09 |
| Alphabet Inc. - Class C | 3.82 | 0.50 | -3.32 |
| Alphabet Inc. - Class A | 3.80 | 0.50 | -3.30 |
| NVIDIA Corporation | 3.30 | 0.90 | -2.40 |
| Tesla Inc. | 2.75 | 0.84 | -1.91 |
| Meta Platforms, Inc. | 2.48 | 1.03 | -1.45 |
| PepsiCo, Inc. | 2.28 | 1.02 | -1.26 |
| Broadcom Inc. | 2.08 | 1.03 | -1.05 |
| Total | 50.92 | 8.77 | -42.15 |
Source: NASDAQ, as of December 31, 2022. One cannot invest directly in an index.
Implementation Ideas
The Direxion NASDAQ-100® Equal Weighted Index Shares (QQQE) offers investors an inexpensive option for gaining access to securities in the NASDAQ-100® Index without the concentrated exposure to the largest names in the index found in the cap weighted approaches.
*Definitions
Cap Weight: Cap weight represents the NASDAQ 100® Index. The NASDAQ 100® Index includes 100 of the largest non-financial securities listed on NASDAQ weighted by market capitalization.
Equal Weight: Equal weight represents the NASDAQ 100® Equal Weighted Index. The NASDAQ 100® Equal Weighted Index includes 100 of the largest non-financial securities listed on NASDAQ, but instead of being weighted by market capitalization, each of the constituents is initially set at 1.00% at rebalancing. The index is reviewed and adjusted annually in December, but replacements may be made any time throughout the year. The index is rebalanced quarterly in March, June, September and December.
An investor should consider the investment objectives, risks, charges, and expenses of Direxion Shares carefully before investing. The prospectus and summary prospectus contain this and other information about Direxion Shares. To obtain a prospectus and summary prospectus call 866-476-7523 or visit our website at direxion.com. The prospectus and summary prospectus should be read carefully before investing.
Direxion Shares Risks: An investment in the Fund involves risk, including the possible loss of principal. The Fund is non-diversified and includes risks associated with concentration that results from the Fund’s investments in a limited number of securities. Risks of the Fund include Index Correlation/ Tracking Risk, Index Strategy Risk, Currency Exchange Rate Risk, Foreign Securities Risk, as well as risks related to the market capitalizations of the securities, and the specific industries or sectors, in which the Fund may invest. Please see the summary and full prospectuses for a more complete description of these and other risks of the Fund.