Yielding to the Yield Curve

In an effort to combat the highest levels of inflation in decades, the Federal Reserve has tightened monetary policy at the fastest pace since the Volcker era of the 1980s. Since March 2022, the Fed has increased rates by 2.25%. These hikes have contributed to a flattening of the yield curve as short-term interest rates have increased more than longer-term interest rates. The commonly referenced spread between the difference in yield on 10-year US Treasuries and 2-year US Treasuries is the most inverted it has been since 2000. As highlighted in the figure below, the average between the two yields since 1977 is 0.92%, as debt with longer maturities typically yields more than short-term debt. Economists tend to view yield curve inversion as negative, seeing as it implies the long-term outlook is weak and the yield curve has historically served as a reliable indicator of the potential for future recession.
The US Treasury Yield is the Most Inverted since 2000
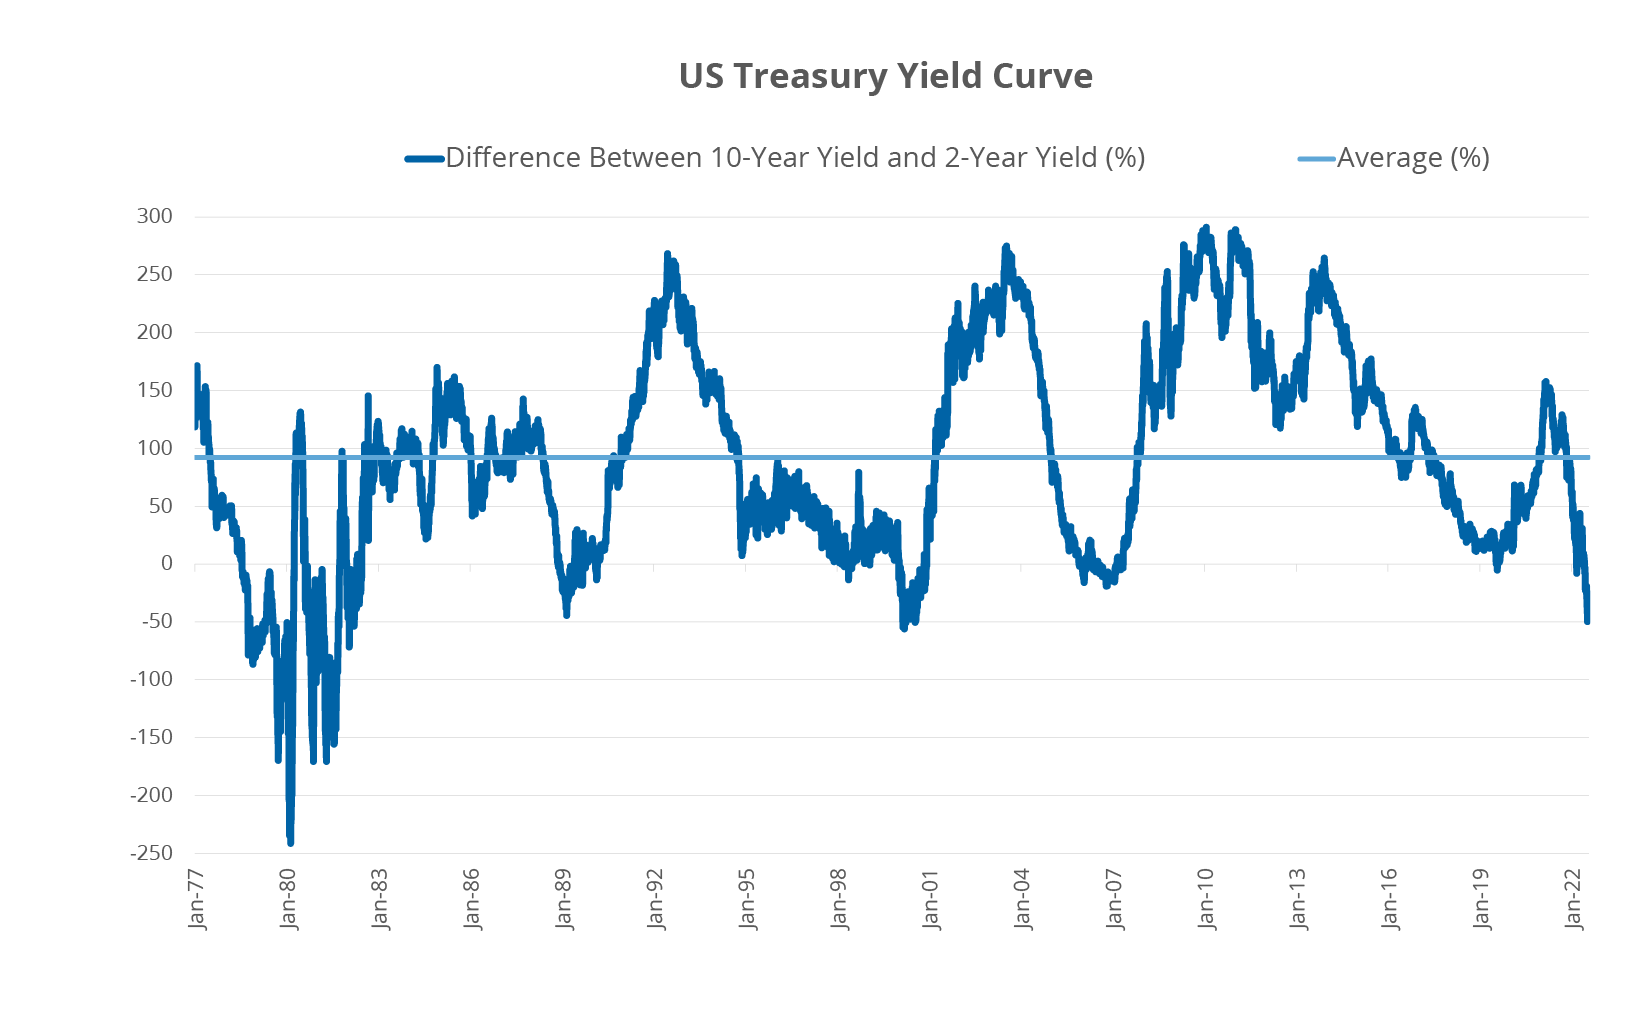
Source: Bloomberg Finance, L.P., as of August 23, 2022.
With the considerable moves in rates, stocks sharply discounted these policy actions as rates moved from extremely accommodative to a more neutral stance. Some may argue that the response from stocks was overly pessimistic, but because they are forward looking, they started to price in rates that would restrict economic growth early on. Stocks, as measured by the S&P 500 Index, peaked in early January 2022 and have been wobbly ever since. More recently, stocks recovered some and sit above their 50-day moving average. However, they recently tested their downward sloping 200-day moving average, but were unable to breakthrough and have since pulled back again. While moving averages have limited predictive power in isolation, these trends do point to why some are questioning the duration of this rally.
Index Remains Below its 200-Day Moving Average
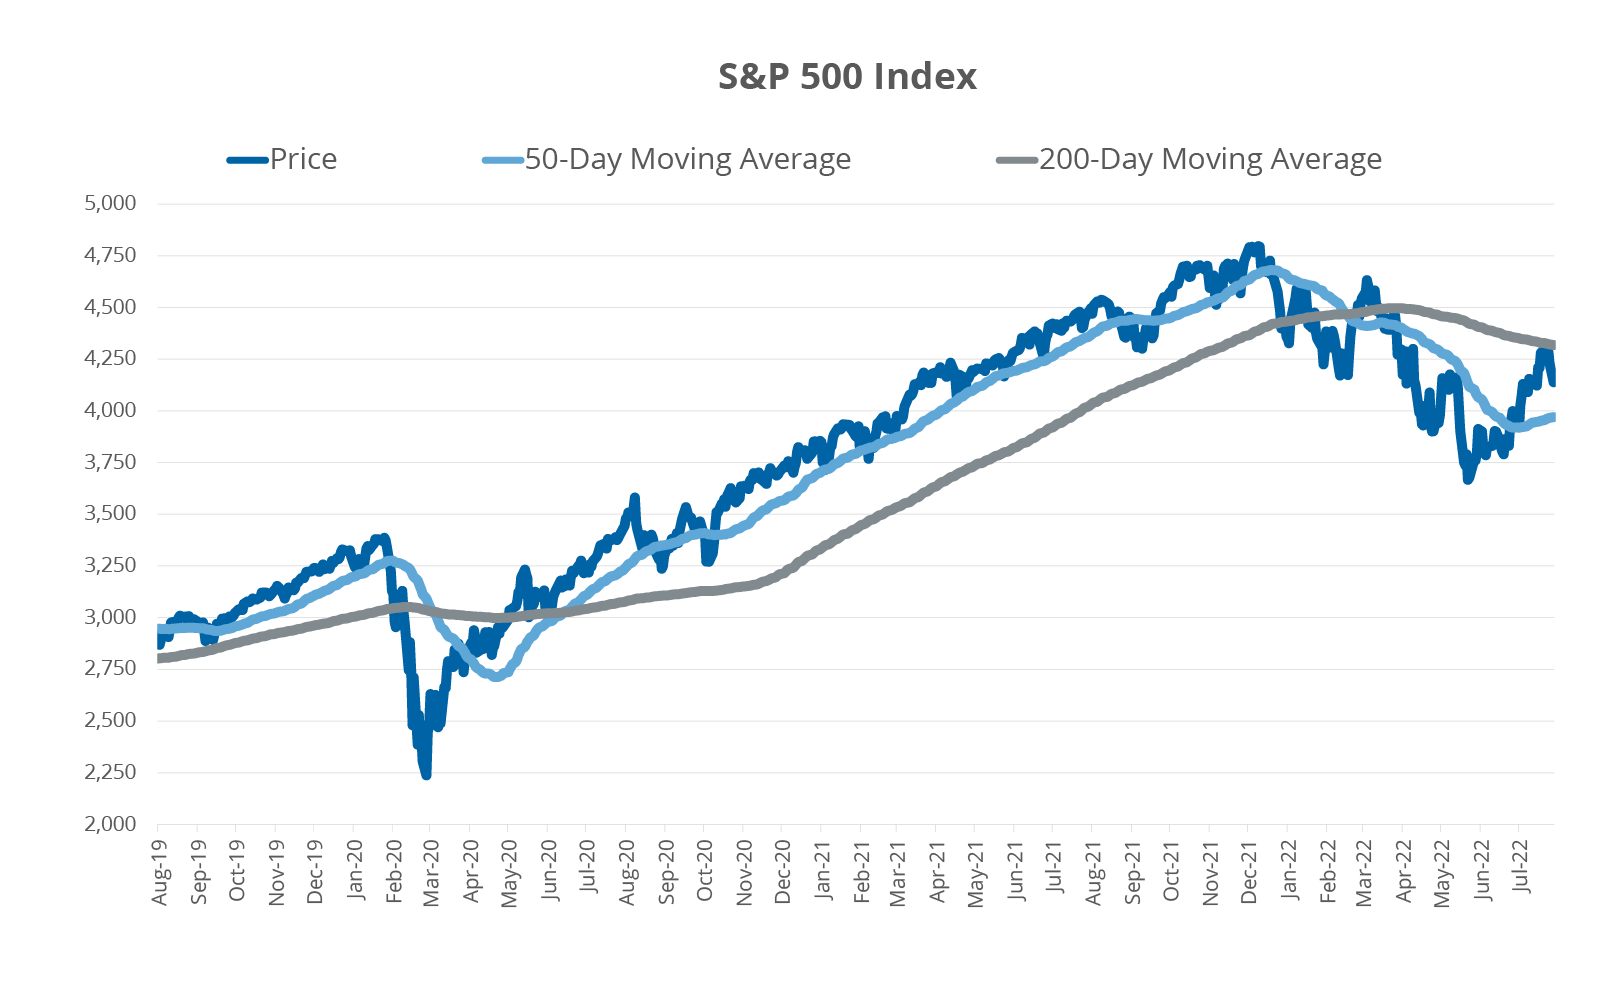
Source: Bloomberg Finance, L.P., as of August 23, 2022. Past Performance is not indicative of future results. You cannot invest directly in an index.
Driven by sharp contraction in the services sector, the S&P Global US Composite PMI for August fell to its lowest level since May 2020. More concerning for Bears is the August reading of 45.0 would be at its lowest since 2009 if the early pandemic months are excluded. Readings below 50.0 indicate contraction, while readings above 50.0 indicate expansion. On the flipside, manufacturing, a smaller portion of the US economy, sits at 51.3, but still declined for the fourth consecutive month.
US Services PMI is Collapsing
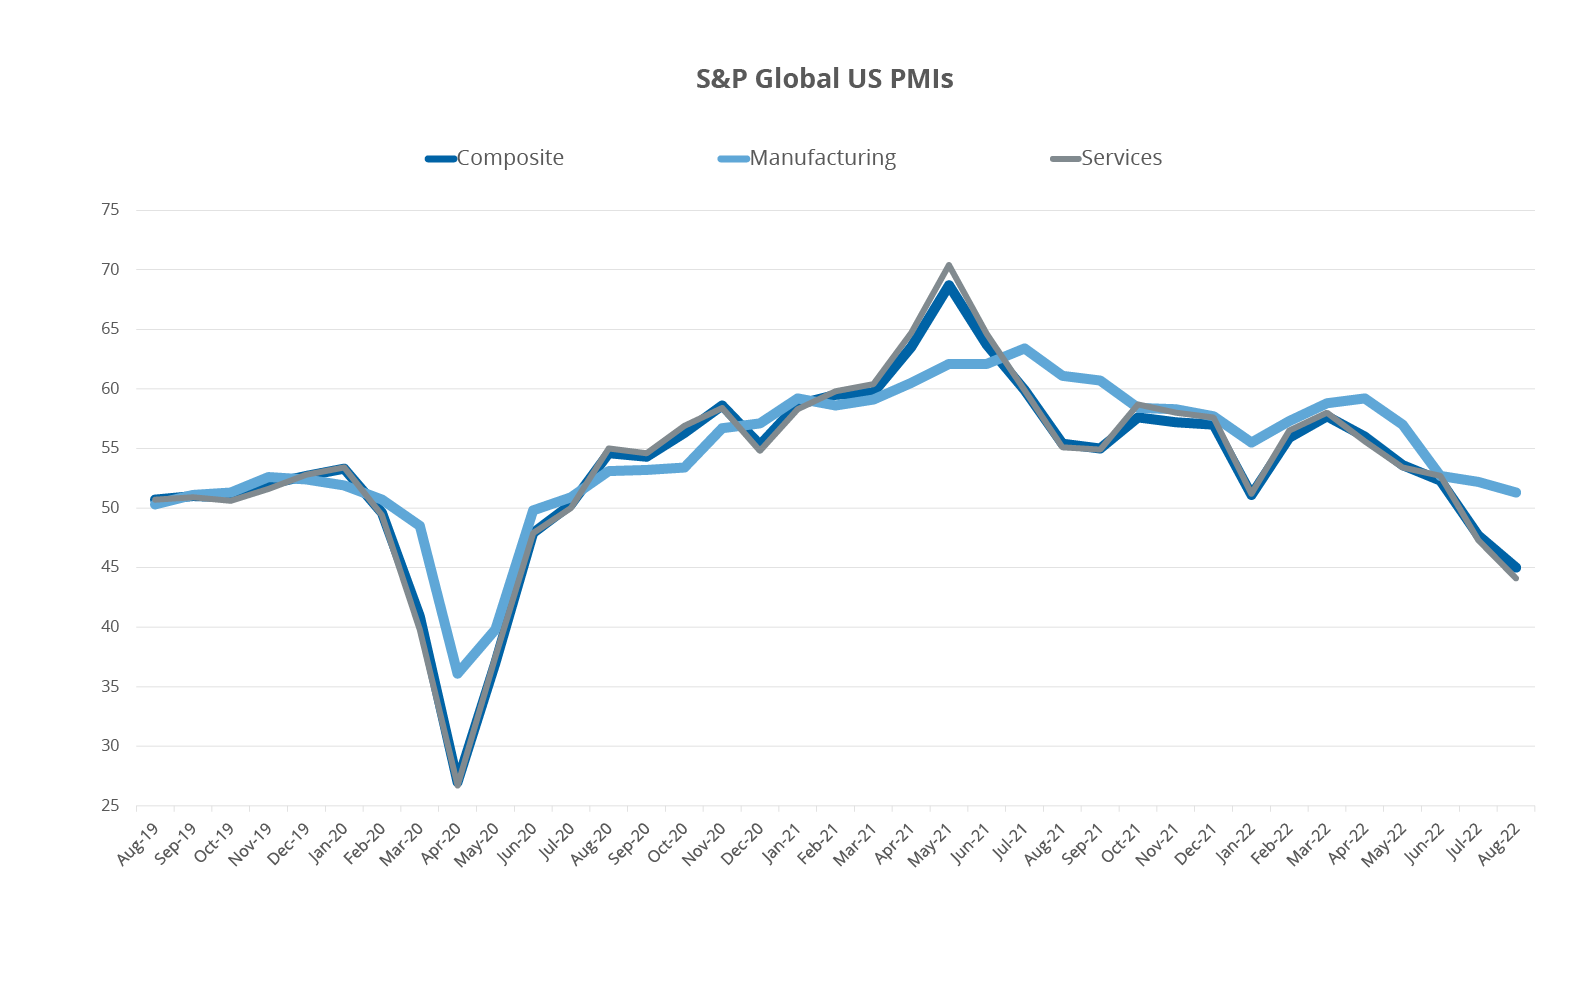
Source: Bloomberg Finance, L.P., as of August 23, 2022.
While markets took kindly to better than feared corporate earnings and favorable economic data over the last eight or so weeks, Chairman Powell’s speech at the Jackson Hole confab on Friday did not give stocks the additional boost in sentiment many had hoped for. Powell delivered a hawkish speech that outlined the dangers of inflation and hinted at another 0.75% hike in September. Beyond September, rate increases will likely return to more modest 0.25% or 0.50%, which may benefit innovative growth sectors that saw their price multiples decline sharply for the better part of the last eighteen months. These areas include hydrogen companies in the clean energy space and firms involved with mRNA technologies across the healthcare complex. In addition to trading at more attractive multiples, these areas have catalysts such as the Inflation Reduction Act and enhanced COVID-19 boosters to further boost interest in these disruptive spaces. Overall, investors will likely remain on edge for the coming weeks as they look to discern whether further gains for stocks will remain challenged, or if they can move further out on the risk spectrum.
An investor should carefully consider a Fund’s investment objective, risks, charges, and expenses before investing. A Fund’s prospectus and summary prospectus contain this and other information about the Direxion Shares. To obtain a Fund’s prospectus and summary prospectus call 866-476-7523 or visit our website at www.direxion.com. A Fund’s prospectus and summary prospectus should be read carefully before investing.
An investment in the Fund involves risk, including the possible loss of principal. The Fund is non-diversified and includes risks associated with the Fund concentrating its investments in a particular industry, sector, or geographic region which can result in increased volatility. The use of derivatives such as futures contracts and swaps are subject to market risks that may cause their price to fluctuate over time. Risks of the Fund include Effects of Compounding and Market Volatility Risk, Market Risk, Market Disruption Risk, Aggressive Investment Techniques Risk, Counterparty Risk, Shorting Risk, Cash Transaction Risk, Intra-Day Investment Risk, Daily Inverse Index Correlation/Tracking Risk, and risks specific to the securities that comprise the S&P 500® Index. Please see the summary and full prospectuses for a more complete description of these and other risks of the Fund.