Did Biotech Just Find a Path for the Bulls?

Editor's note: Any and all references to time frames longer than one trading day are for purposes of market context only, and not recommendations of any holding time frame. Daily rebalancing ETFs are not meant to be held unmonitored for long periods. If you don't have the resources, time or inclination to constantly monitor and manage your positions, leveraged and inverse ETFs are not for you.
It’s been a rough couple of years for the biotech sector, as it grappled with the fallout from the post-covid world. Despite there being no shortage of innovation in the past several years, it seems that there was some misallocation of how that innovation would pay off. But after a solid start to 2024, could the worst for the sector be in the past?
A New Wave of Innovation to Spark Bulls
Followers of the biotech sector may have noticed a substantial sentiment shift over the past couple months, from one that was previously of despair, towards more optimism. The industry is moving out of survival mode and back into innovation mode.
There’s been increased merger and acquisition activity, as well as a significant uptick in fundraising for the sector. This trend may be partly due to expectations that the Federal Reserve may cut interest rates this year, which means the cost to borrow could drop considerably.
There’s also been enormous advancements in weight-loss drugs and treatments that have sparked renewed interest in the sector, along with the potential to incorporate advancements in artificial intelligence in the medical space.
Traders that think it’s still early in the biotech rally may find an opportunity with Direxion’s Daily S&P Biotech Bull 3X Shares (Ticker: LABU), which seeks daily investment results, before fees and expenses, of 300% of the S&P Biotechnology Select Industry Index*.
Below is a daily chart of LABU as of March 8, 2024.
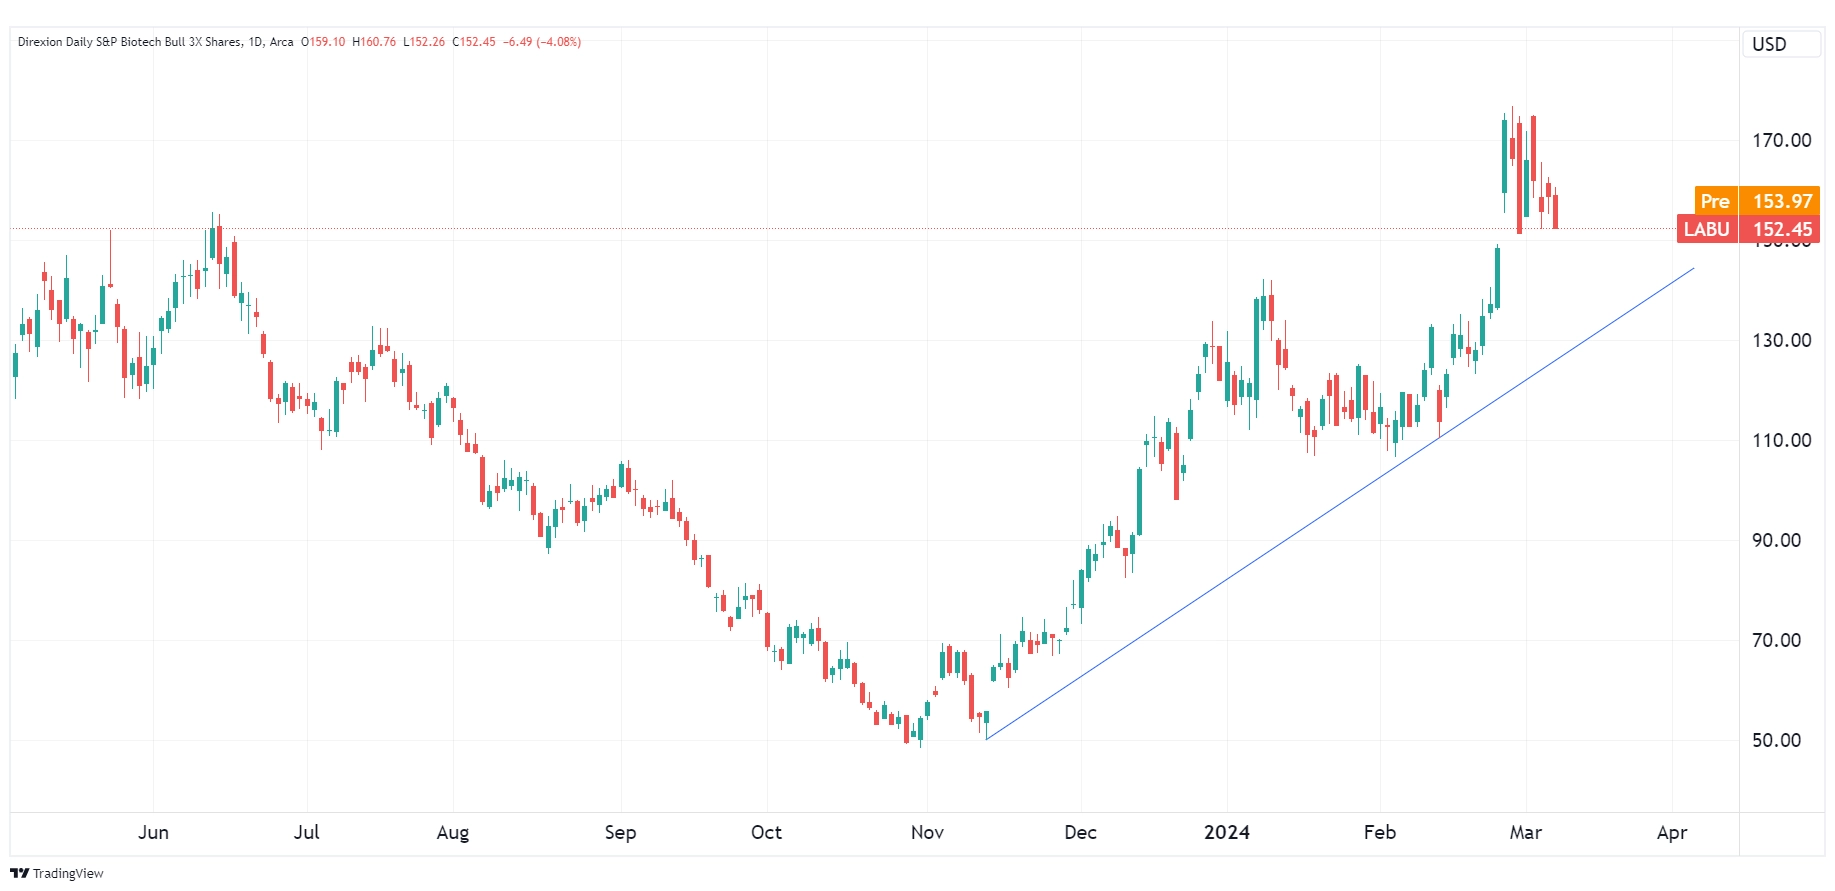
Source: TradingView.com
Candlestick charts display the high and low (the stick) and the open and close price (the body) of a security for a specific period. If the body is filled, it means the close was lower than the open. If the body is empty, it means the close was higher than the open.
The performance data quoted represents past performance. Past performance does not guarantee future results. The investment return and principal value of an investment will fluctuate. An investor’s shares, when redeemed, may be worth more or less than their original cost; current performance may be lower or higher than the performance quoted. For the most recent month-end performance go to Direxion.com/etfs. For standardized performance click here.
The slanted blue line represents an uptrend. An uptrend describes the price movement of a financial asset when the overall direction is upward.
What If Sector Earnings Fail to Follow Through?
Although there is renewed optimism in the biotech space, it eventually needs to translate into tangible earnings in order for the rally to stick. Otherwise, this could end up being a relief rally amid a broader downtrend in the sector.
Traders that are skeptical about biotech’s comeback may find a position with Direxion’s Daily S&P Biotech Bear 3X Shares (Ticker: LABD), which seeks daily investment results, before fees and expenses, of 300% of inverse (or opposite) of the S&P Biotechnology Select Industry Index.
It’s important that traders stay on the lookout for the next earnings reports for Cytokinetics (Ticker: CYTK), Karuna Therapeutics (Ticker: KRTX), and Acadia Pharmaceuticals (Ticker: ACAD). These represent some of the top holdings in LABU and LABD.
ACAD’s next earnings date is on April 30, followed by CYTK on May 1, and KRTX on May 2. Any meaningful report below estimates could send LABD surging, but on the other hand, a strong beat could be a boon for LABU.
To view the Fund’s full holdings, click here. Holdings are subject to risk and change.
Below is a daily chart of LABD as of March 8, 2024.
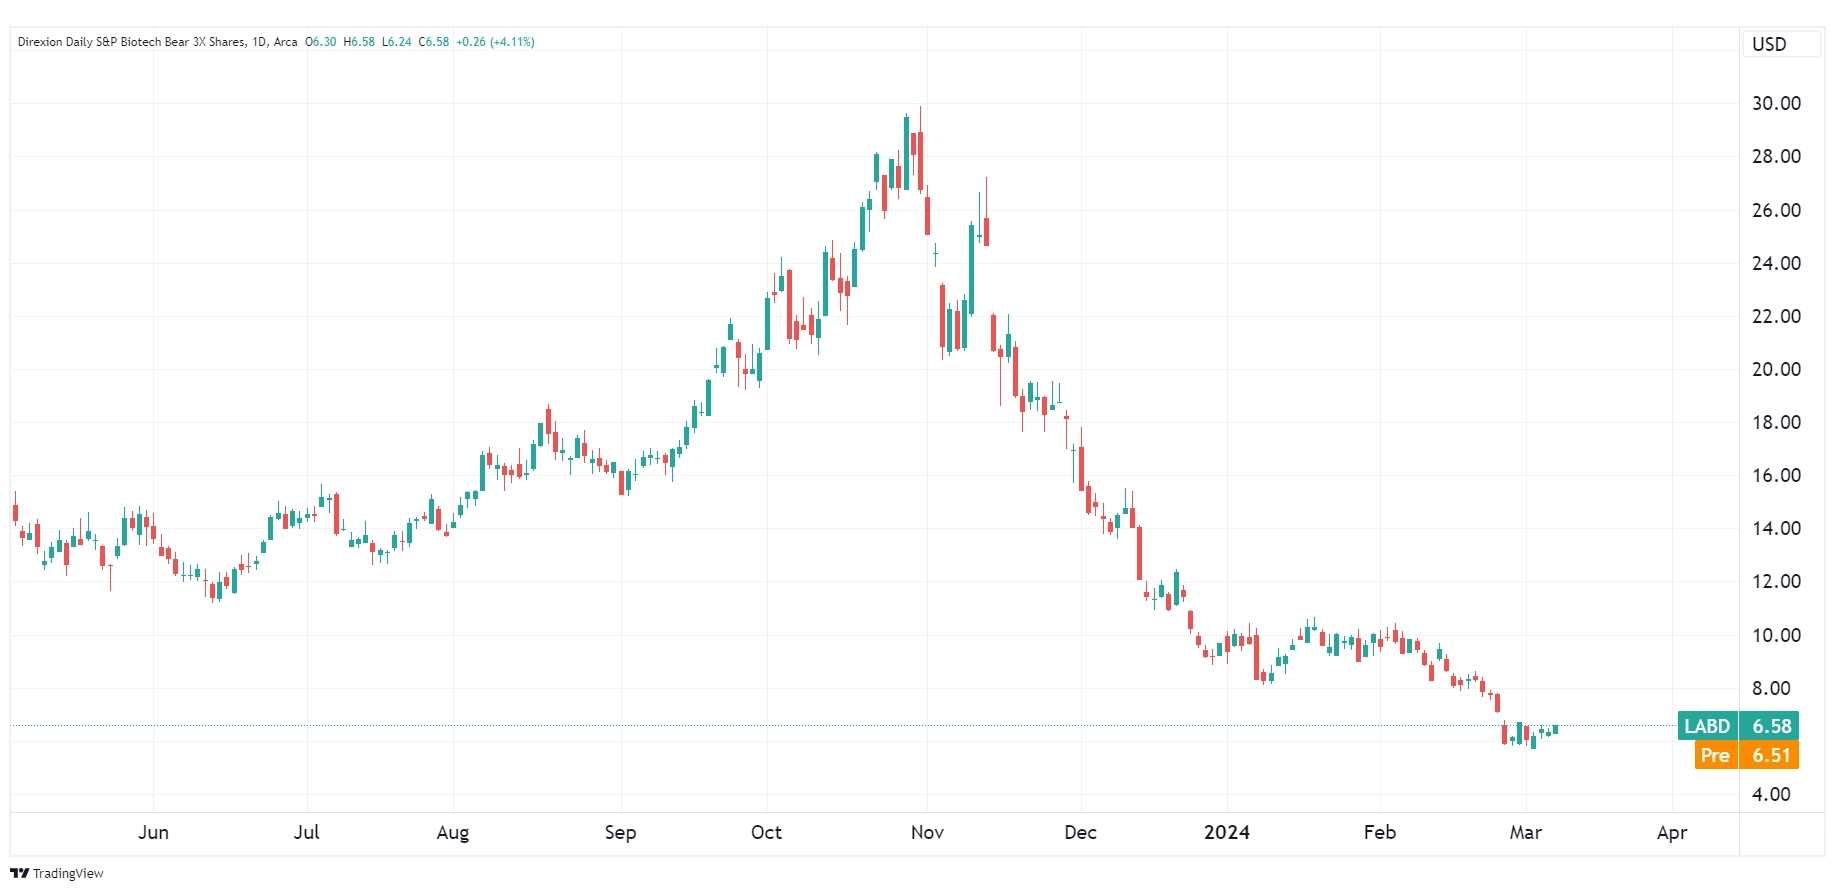
Source: TradingView.com
Candlestick charts display the high and low (the stick) and the open and close price (the body) of a security for a specific period. If the body is filled, it means the close was lower than the open. If the body is empty, it means the close was higher than the open.
The performance data quoted represents past performance. Past performance does not guarantee future results. The investment return and principal value of an investment will fluctuate. An investor’s shares, when redeemed, may be worth more or less than their original cost; current performance may be lower or higher than the performance quoted. For the most recent month-end performance go to Direxion.com/etfs. For standardized performance click here.
Additional Growth Plays
Traders seeking opportunities in other growth sectors in the market may consider Direxion’s Daily Pharmaceutical & Medical Bull 3X Shares (Ticker: PILL), which seeks daily investment results, before fees and expenses, of 300% of the performance of the S&P Pharmaceuticals Select Industry Index.
There’s also a leveraged lay for technology via Direxion’s Daily Technology Bull 3X Shares (Ticker: TECL), and Daily Technology Bear 3X Shares (Ticker: TECS), which seek daily investment results, before fees and expenses, of 300%, or -300%, respectively, of the performance of the Technology Select Sector Index.
*Definitions and Index Descriptions
An investor should carefully consider a Fund’s investment objective, risks, charges, and expenses before investing. A Fund’s prospectus and summary prospectus contain this and other information about the Direxion Shares. To obtain a Fund’s prospectus and summary prospectus call 866-476-7523 or visit our website at direxion.com. A Fund’s prospectus and summary prospectus should be read carefully before investing.
Leveraged and Inverse ETFs pursue daily leveraged investment objectives which means they are riskier than alternatives which do not use leverage. They seek daily goals and should not be expected to track the underlying index over periods longer than one day. They are not suitable for all investors and should be utilized only by sophisticated investors who understand leverage risk and who actively manage their investments.
The S&P Biotechnology Select Industry Index (SPSIBITR) is provided by S&P Dow Jones Indices LLC and includes domestic companies from the biotechnology industry. The Index is a modified equal-weighted index that is designed to measure the performance of the biotechnology sub-industry based on the Global Industry Classification Standards (GICS).
The S&P Pharmaceuticals Select Industry Index (SPSIPHTR) is a modified equal-weighted index that is designed to measure performance of the stocks comprising the S&P Total Market Index that are classified in the Global Industry Classification Standard (GICS) pharmaceuticals sub-industry.
The Technology Select Sector Index (IXTTR) is provided by S&P Dow Jones Indices and includes domestic companies from the technology sector which includes the following industries: computers and peripherals; software; diversified telecommunications services; communications equipment; semiconductors and semi-conductor equipment; internet software and services; IT services; electronic equipment, instruments and components; wireless telecommunication services; and office electronics.
The “S&P Biotechnology Select Industry Index” is a product of S&P Dow Jones Indices LLC (“SPDJI”), and has been licensed for use by Rafferty Asset Management, LLC (“Rafferty”). Standard & Poor’s® and S&P® are registered trademarks of Standard & Poor’s Financial Services LLC (“S&P”); Dow Jones® Is a registered trademark of Dow Jones Trademark Holdings LLC (“Dow Jones”); and these trademarks have been licensed for use by SPDJI and sublicensed for certain purposes by Rafferty. Rafferty’s ETFs are not sponsored, endorsed, sold or promoted by SPDJI, Dow Jones, S&P, their respective affiliates and none of such parties make any representation regarding the advisability of investing in such product(s) nor do they have any liability for any errors, omissions, or interruptions of the S&P Biotechnology Select Industry Index.
Direxion Shares Risks – An investment in each Fund involves risk, including the possible loss of principal. The Funds are non-diversified and include risks associated with the Funds’ concentrating their investments in a particular industry, sector, or geography which can increase volatility. The use of derivatives such as futures contracts and swaps are subject to market risks that may cause their price to fluctuate over time. Risks of each Fund include Effects of Compounding and Market Volatility Risk, Leverage Risk, Market Risk, Counterparty Risk, Rebalancing Risk, Intra-Day Investment Risk, Other Investment Companies (including ETFs) Risk, Cash Transaction Risk, Tax Risk, and risks specific to the securities of the Biotechnology Industry and Healthcare Sector. Companies within the biotech industry invest heavily in research and development, which may not lead to commercially successful products. Additional risks include, for the Direxion Daily S&P Biotech Bull 3X Shares, Daily Index Correlation Risk, and for the Direxion Daily S&P Biotech Bear 3X Shares, Daily Inverse Index Correlation Risk, and risks related to Shorting. Please see the summary and full prospectuses for a more complete description of these and other risks of each Fund.
Distributor: Foreside Fund Services, LLC.