Small Cap Stocks: Ready for Gain? Or More Pain?

Editor's note: Any and all references to time frames longer than one trading day are for purposes of market context only, and not recommendations of any holding time frame. Daily rebalancing ETFs are not meant to be held unmonitored for long periods. If you don't have the resources, time or inclination to constantly monitor and manage your positions, leveraged and inverse ETFs are not for you.
U.S. large cap* stocks have enjoyed a pretty good 2023 so far with the S&P 500® Index* up nearly 15% year-to-date (as of 9/21/23). Small caps* didn’t get the memo, though. The benchmark Russell 2000® Index* has only posted a meager 2% gain since we turned the page on 2022. For traders, the question is whether this underperformance continues or if it’s time to put the contrarian hats on and buy small caps.
Visualizing the Underperformance
The following one-year chart shows the relative performance of large caps (the S&P 500® Index) vs. small caps (the Russell 2000®). When the line is rising, small caps are lagging their bigger siblings. Small caps have had their moments, but there’s a clear trend in place. From the lower left to the upper right, as newsletter writer Dennis Gartman was fond of saying: Turns out, size has mattered.
One compelling explanation for this divergence in fortunes? Mega-cap* tech. The S&P has it, the Russell does not. The Technology Select Sector Index*, which contains the tech stocks in the S&P 500®, up over 30% year-to-date has given quite the shot in the arm to large caps in general.
Relative Performance Chart: S&P 500 vs. Russell 2000
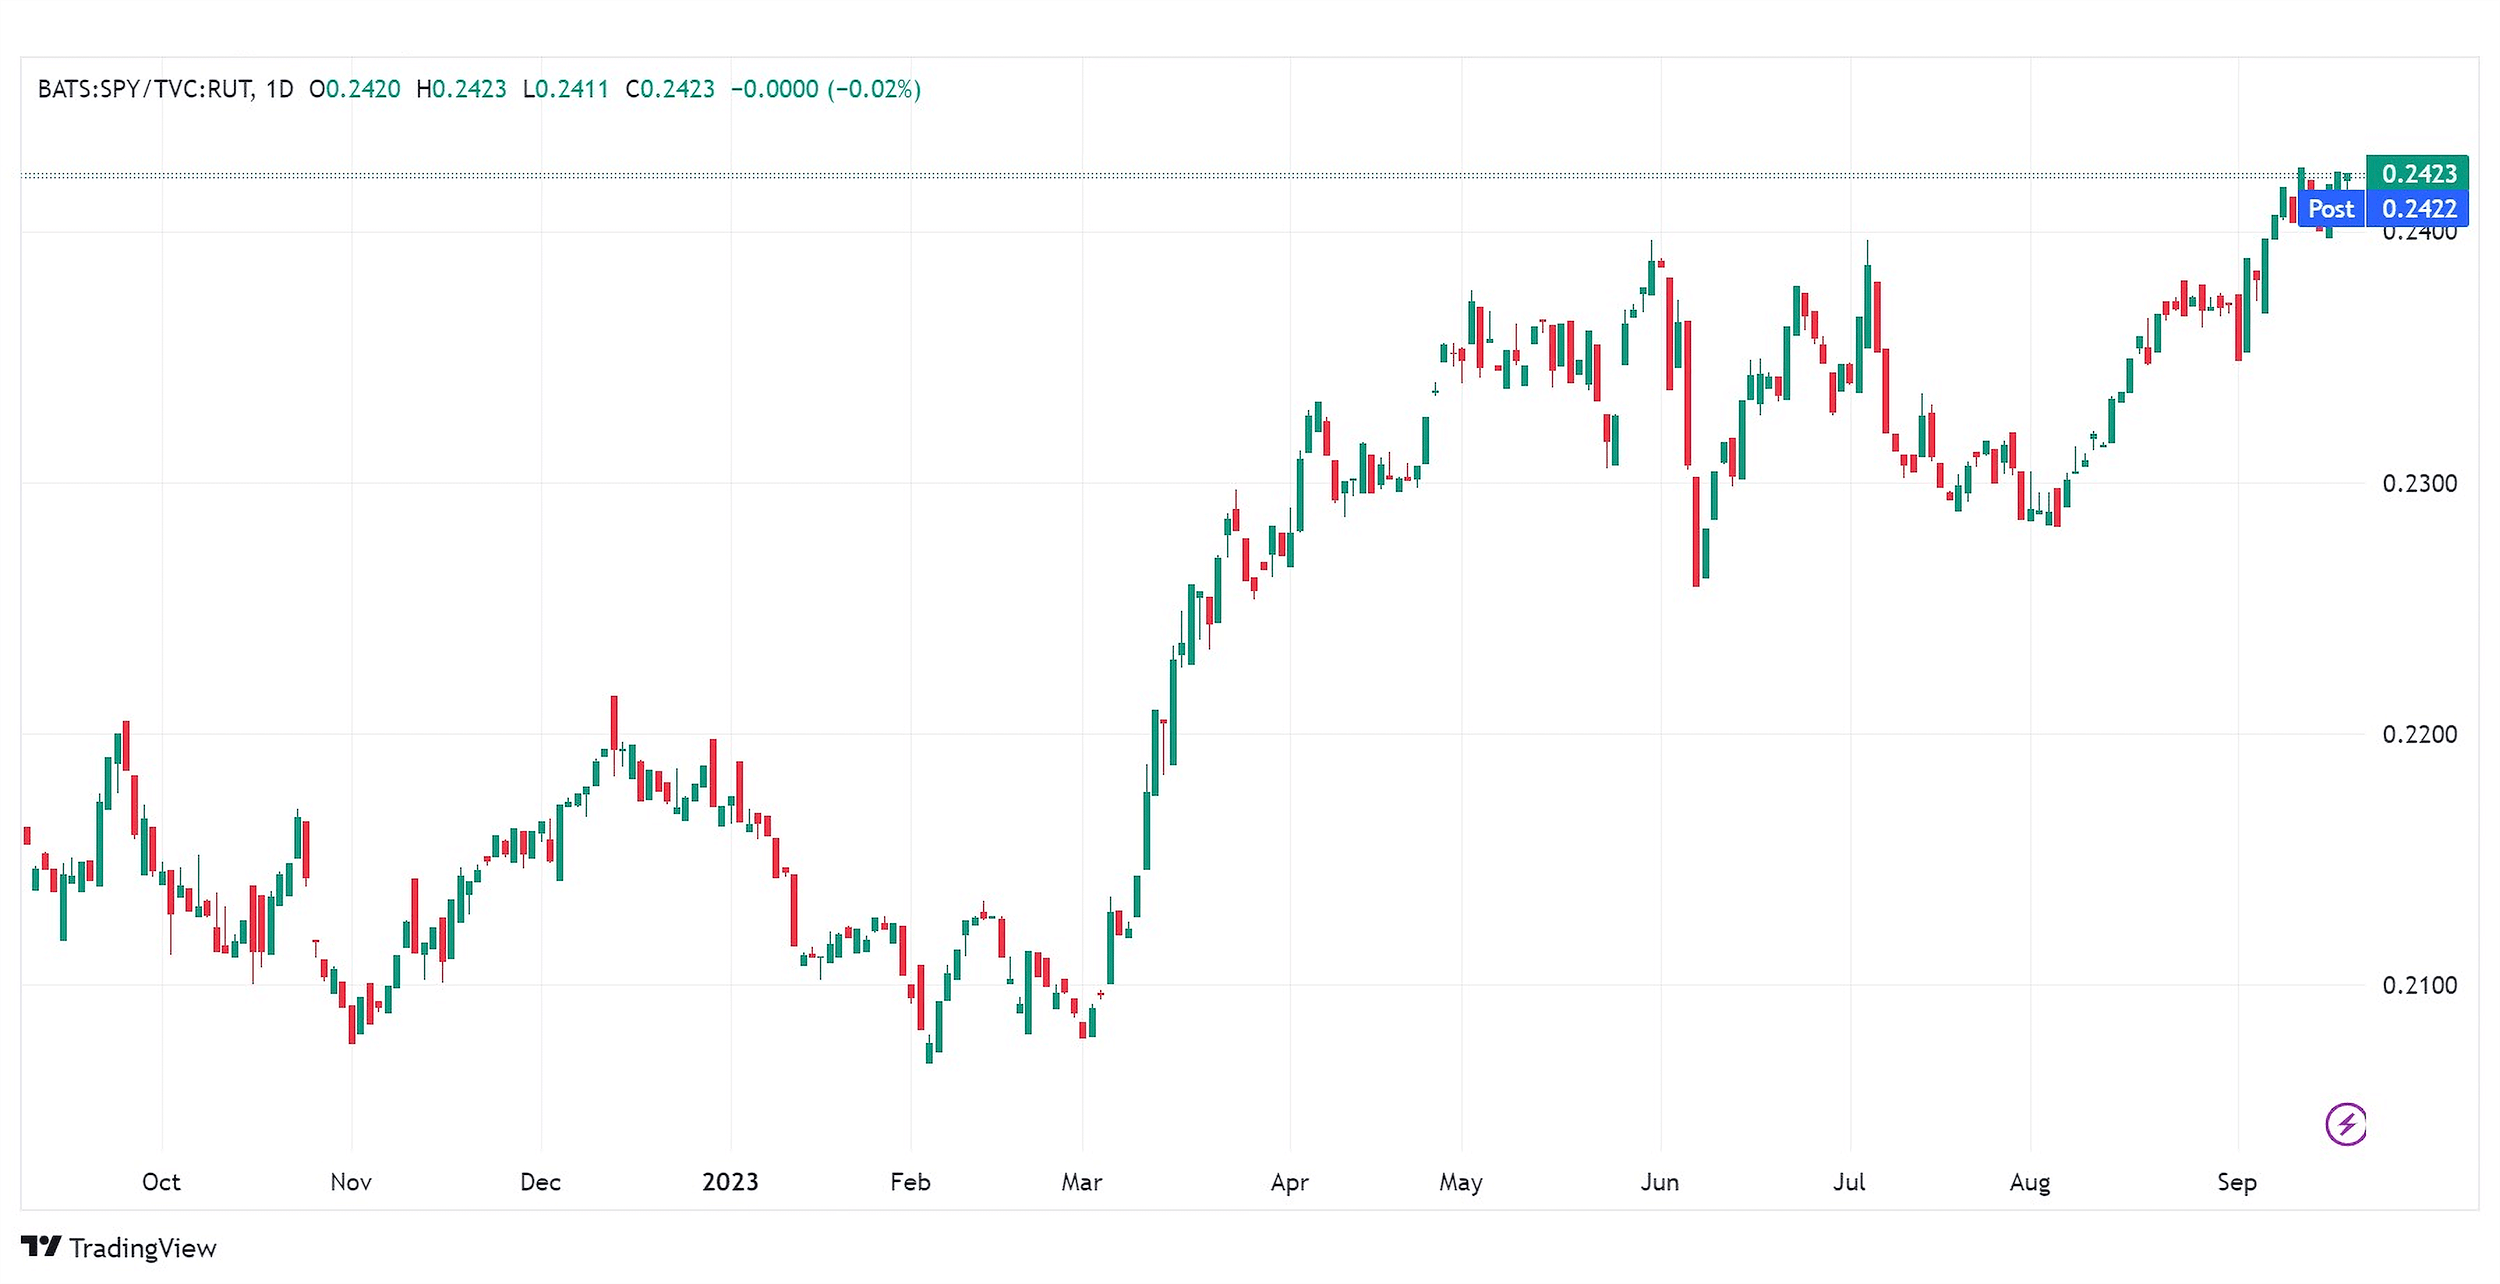
Source: TradingView.com, September 20, 2023.
Candlestick charts display the high and low (the stick) and the open and close price (the body) of a security for a specific period. If the body is filled, it means the close was lower than the open. If the body is empty, it means the close was higher than the open.
Performance data quoted represents past performance and is no guarantee of future results. You cannot invest directly in an index.
Small Caps in Isolation
Okay, but how do small caps look by themselves? Not great. We’ve got a clear top in early August and the Russell 2000® has just broken below support that held in late June. The 1,800 level on the index acted as resistance in April and many technical analysts will tell you that former resistance can be future support. Time will tell.
Russell 2000 Index Performance
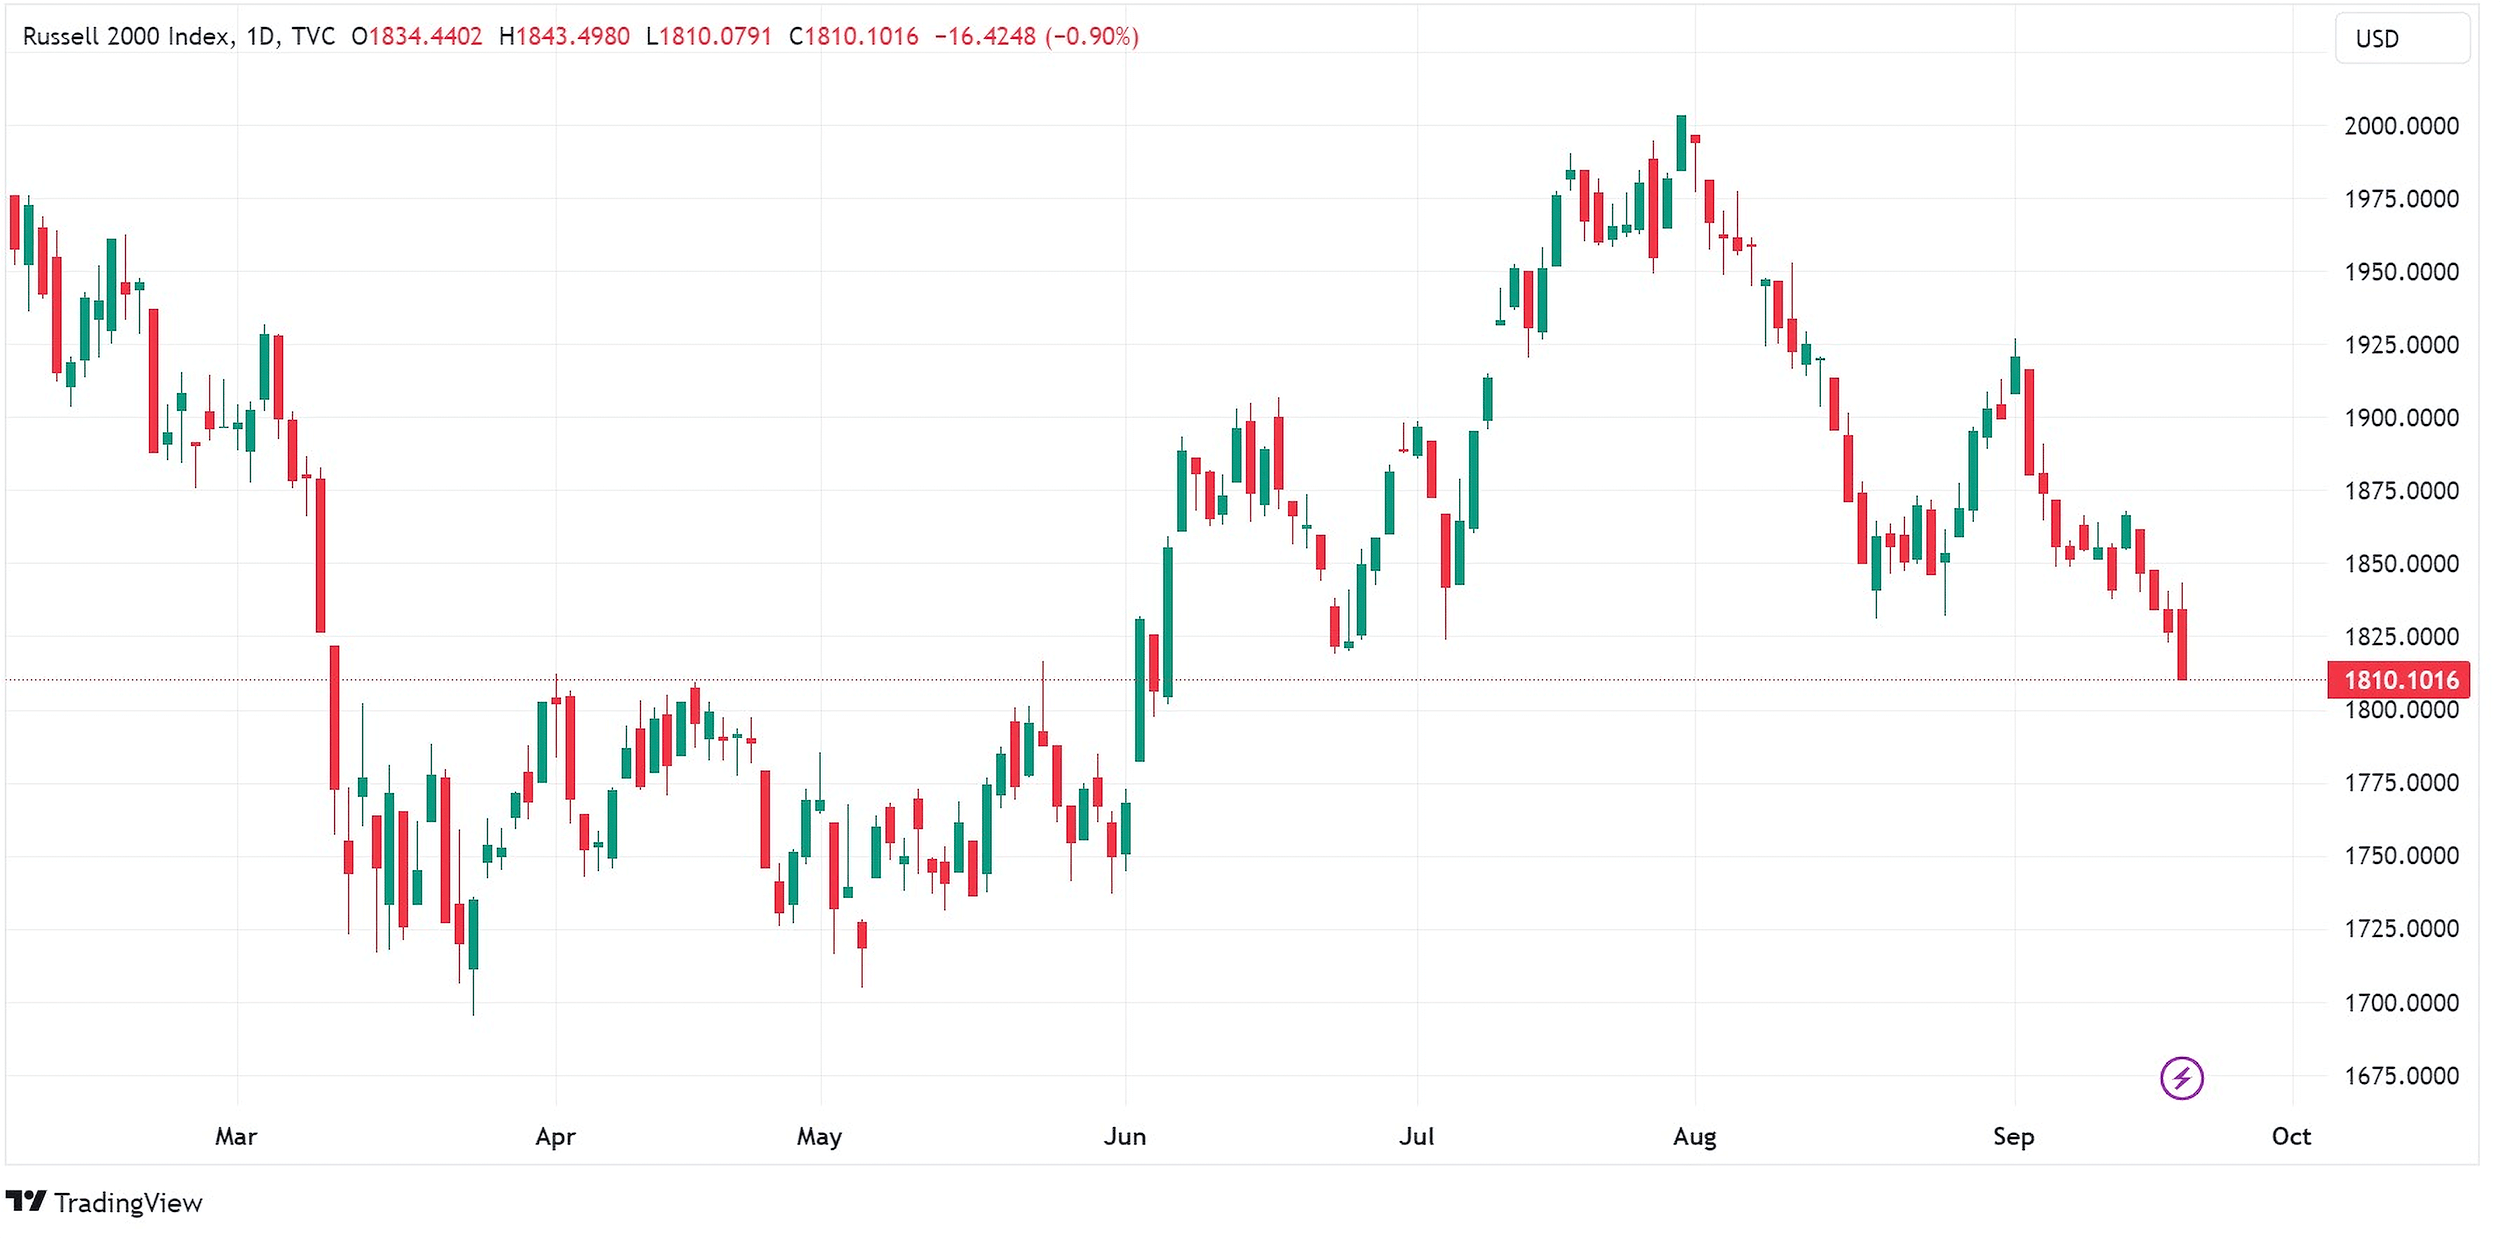
Source: TradingView.com, September 20, 2023.
Performance data quoted represents past performance and is no guarantee of future results. You cannot invest directly in an index.
Catalysts for a Revival in Small Caps
A number of catalysts could bring investors back to small caps in the coming weeks and months:
- Mega-cap tech could take a big tumble: If air comes out of the AI/big tech balloon, traders and investors might seek the relative safety of small caps. Usually they’re not seen as safe, but with the Russell trading at a price/earnings ratio* under 12, there’s hardly lots of froth to worry about.
- Fears of a recession could recede even more: The Russell 2000® is heavily weighted towards cyclicals. If investors’ fears of a recession largely disappear, expectations for these companies’ earnings could increase.
- Long-term interest rates could keep rising: A further breakout of the 10-year yield would probably hit tech stocks very hard, but the Russell may not be as affected given that regional banks form a decent chunk of the index and may benefit from higher rates.
A High-Risk Long or Short
Small caps tend to be a high-octane play on the overall equities market. If markets rally into year-end and we see broadening participation (better breadth) small caps could be the recovery story of the year. Sort of like a runner that catches up to everyone else in the last lap of the race.
Bulls can seek to turbocharge any potential index gains in small caps with the Direxion Daily Small Cap Bull 3X Shares (Ticker: TNA), which seeks to track 300%, before fees and expenses, of the daily performance of the Russell 2000® Index.
For traders bearish on the market, betting against the smaller stocks can be a way to get more bang for the buck if equities crumble. From a seasonal perspective, fall is often a treacherous time for markets.
Bears have the opportunity to attempt to benefit from potential further downward index moves in small caps with the Direxion Daily Small Cap Bear 3X Shares (Ticker: TZA), which seeks to track 300% of the inverse (or opposite), before fees and expenses, of the daily performance of the Russell 2000® Index.
*Definitions and Index Descriptions
An investor should carefully consider a Fund’s investment objective, risks, charges, and expenses before investing. A Fund’s prospectus and summary prospectus contain this and other information about the Direxion Shares. To obtain a Fund’s prospectus and summary prospectus call 866-476-7523 or visit our website at www.direxion.com. A Fund’s prospectus and summary prospectus should be read carefully before investing.
Leveraged and Inverse ETFs pursue daily leveraged investment objectives which means they are riskier than alternatives which do not use leverage. They seek daily goals and should not be expected to track the underlying index over periods longer than one day. They are not suitable for all investors and should be utilized only by sophisticated investors who understand leverage risk and who actively manage their investments.
The Russell 2000® Index measures the performance of approximately 2,000 small-capitalization companies in the Russell 3000® Index, based on a combination of their market capitalization.
The S&P 500® Index (SPXT) is designed to be comprised of stocks that are the 500 leading, large-cap U.S. listed issuers. The securities are selected on the basis of market capitalization, financial viability of the company, sector representation, public float, liquidity and price of a company’s shares outstanding. The Index is a float-adjusted, market capitalization-weighted index.
The Technology Select Sector Index (IXTTR) is provided by S&P Dow Jones Indices and includes domestic companies from the technology sector which includes the following industries: computers and peripherals; software; diversified telecommunications services; communications equipment; semiconductors and semi-conductor equipment; internet software and services; IT services; electronic equipment, instruments and components; wireless telecommunication services; and office electronics.
One cannot directly invest in and index.
The Russell 2000® Index is a trademark of Frank Russell Company (“Russell”) and has been licensed for use by the Trust. The Direxion Daily Small Cap Bull and Bear 3X Shares are not sponsored, endorsed, sold or promoted by Russell. Russell makes no representation regarding the advisability of investing in the Direxion Daily Small Cap Bull and Bear 3X Shares.
Direxion Shares Risks – An investment in each Fund involves risk, including the possible loss of principal. Each Fund is non-diversified and includes risks associated with the Funds’ concentrating their investments in a particular industry, sector, or geographic region which can result in increased volatility. The use of derivatives such as futures contracts and swaps are subject to market risks that may cause their price to fluctuate over time. Risks of each Fund include Effects of Compounding and Market Volatility Risk, Leverage Risk, Market Risk, Counterparty Risk, Rebalancing Risk, Intra-Day Investment Risk, Other Investment Companies (including ETFs) Risk, Cash Transaction Risk, Tax Risk, and risks specific to investment in micro-cap, small- and/or mid-capitalization securities. Investing in micro-capitalization companies are significantly more volatile as they face greater risk of business failure than companies considered small and/or mid-capitalization companies. Investing in small and/or mid-capitalization securities involves greater risks and the possibility of greater price volatility than investing in larger, more-established companies. Additional risks include, for the Direxion Daily Small Cap Bull 3X Shares, Daily Index Correlation Risk, and for the Direxion Daily Small Cap Bear 3X Shares, Daily Inverse Index Correlation Risk, and risks related to Shorting. Please see the summary and full prospectuses for a more complete description of these and other risks of each Fund.
Distributor: Foreside Fund Services, LLC.