The Xchange Newsletter
The Xchange keeps you informed of the most tradeable market sectors, from both a Bull and Bear perspective.

SpaceX, Concentration Risk, and the Equal-Weight Alternative.
Jul 07, 2026 | 3 min read

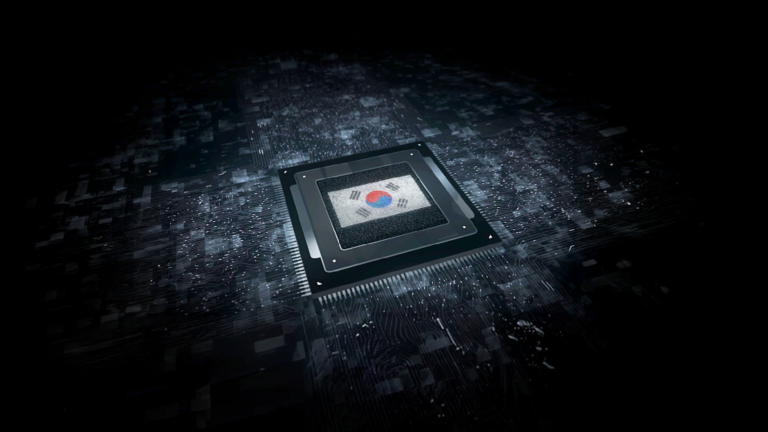
SK hynix, AI Memory Royalty by Proxy
Jul 01, 2026 | 3 min read

The Macro Case for Gold Got Louder. The Price Got Cheaper.
UGLD
Jun 30, 2026 | 3 min read

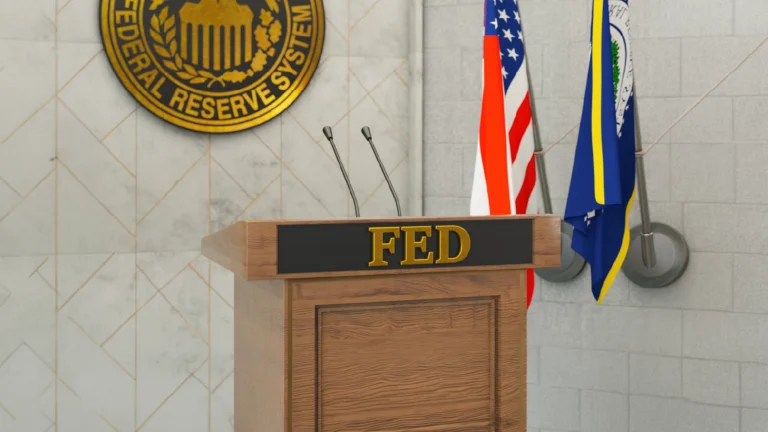
A New Era at the Fed. Warsh Sets the Tone.
Jun 26, 2026 | 3 min read

SpaceX as an IPO Live Case Study
LOFF
Jun 18, 2026 | 3 min read

Houston, We Have Liftoff! Trading the SpaceX IPO with LOFF
Jun 16, 2026 | 3 min read

Liftoff: SpaceX Goes Public on June 12
Jun 05, 2026 | 3 min read

BTCU is Built for the Fast-Moving Bitcoin Market
BTCU/EVMU ...
May 27, 2026 | 3 min read

The Tape Keeps Grinding Higher
NVDD/NVDU ...
May 21, 2026 | 3 min read
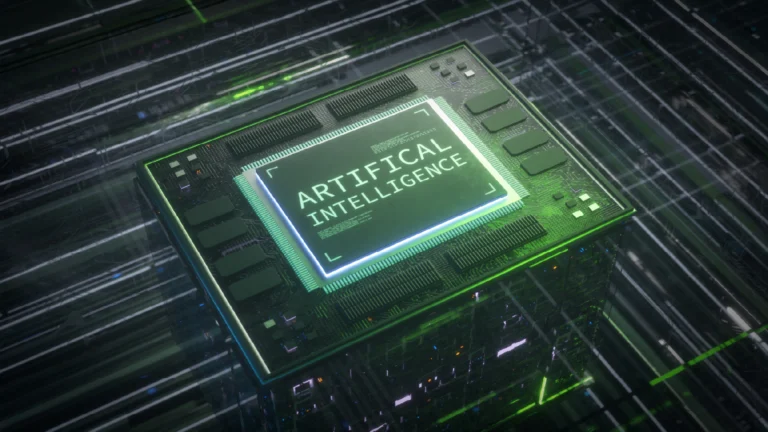
Will Nvidia’s Earnings Rewire the AI Trade?
NVDD/NVDU ...
May 19, 2026 | 3 min read

Demand is Real, Supply is Tightening.
METD/METU ...
May 08, 2026 | 3 min read

Can Microsoft and Meta Earnings Right the Mag 7 Ship?
METD/METU ...
Apr 28, 2026 | 3 min read
Biotech, Banks, and Bonds: Trading the Fed’s April Meeting
FAS/FAZ ...
Apr 28, 2026 | 3 min read

Volatility Meets Earnings Season – Q1 2026
Apr 22, 2026

Crude Awakening: Oil, DFENs, & the Return of the War Trade.
DFEN/GUSH
Apr 13, 2026 | 3 min read

Tesla Needs a Charge. Netflix Needs a Plot Twist
NFXL/TSLL
Apr 13, 2026 | 3 min read