Time to Get Real About the Real Estate Trade

Editor's note: Any and all references to time frames longer than one trading day are for purposes of market context only, and not recommendations of any holding time frame. Daily rebalancing ETFs are not meant to be held unmonitored for long periods. If you don't have the resources, time or inclination to constantly monitor and manage your positions, leveraged and inverse ETFs are not for you.
Coming into 2023, many market participants were calling for a significant correction in the real estate market. Prices have indeed cooled off from their highs over the past few months, but are nowhere near crash territory. Could this turn out to be a buying opportunity within the longer-term bull trend? Or will real estate implode under the weight of higher interest rates?
A Hard Asset to Weather Inflation
Real estate is a market that ultimately comes down to cash flow. But compared to equity markets, it’s much less liquid, which means that its price fluctuations take more time to respond to market conditions.
The S&P CoreLogic Case-Shiller U.S. National Home Price Index was just released for the month of December, which showed a 5.8% year-over-year increase. However, prices have dropped 4.4% from their June peak. The main culprit behind the cooler market is higher financing costs, as buyers have to reevaluate whether their cash flow can handle higher interest expenses. Traders would be wise to keep a close watch on the next Case-Shiller U.S. National Home Price Index report, which is set to be released on March 28. This is an especially important reading because the end of March starts prime homebuying season, and this report could easily set the tone for the following months.
Traders should keep in mind that this is a very different market fundamentally compared to 2007-2009. There is a lot less inventory now, and cash-buying activity is notably higher. Buyers that pay with cash outright don’t have to worry about interest rate risk, and they’re often looking to park significant amounts of capital into hard assets, which tend to appreciate in an inflationary environment.
For traders that think that real estate can overcome rising interest rates in this inflationary economic environment, Direxion offers the Daily Real Estate Bull 3X Shares (Ticker: DRN) , which seeks to track 300%, before fees and expenses, of the daily performance of the Real Estate Sector Select Index*.
Below is a daily chart of DRN as of March 2, 2023.
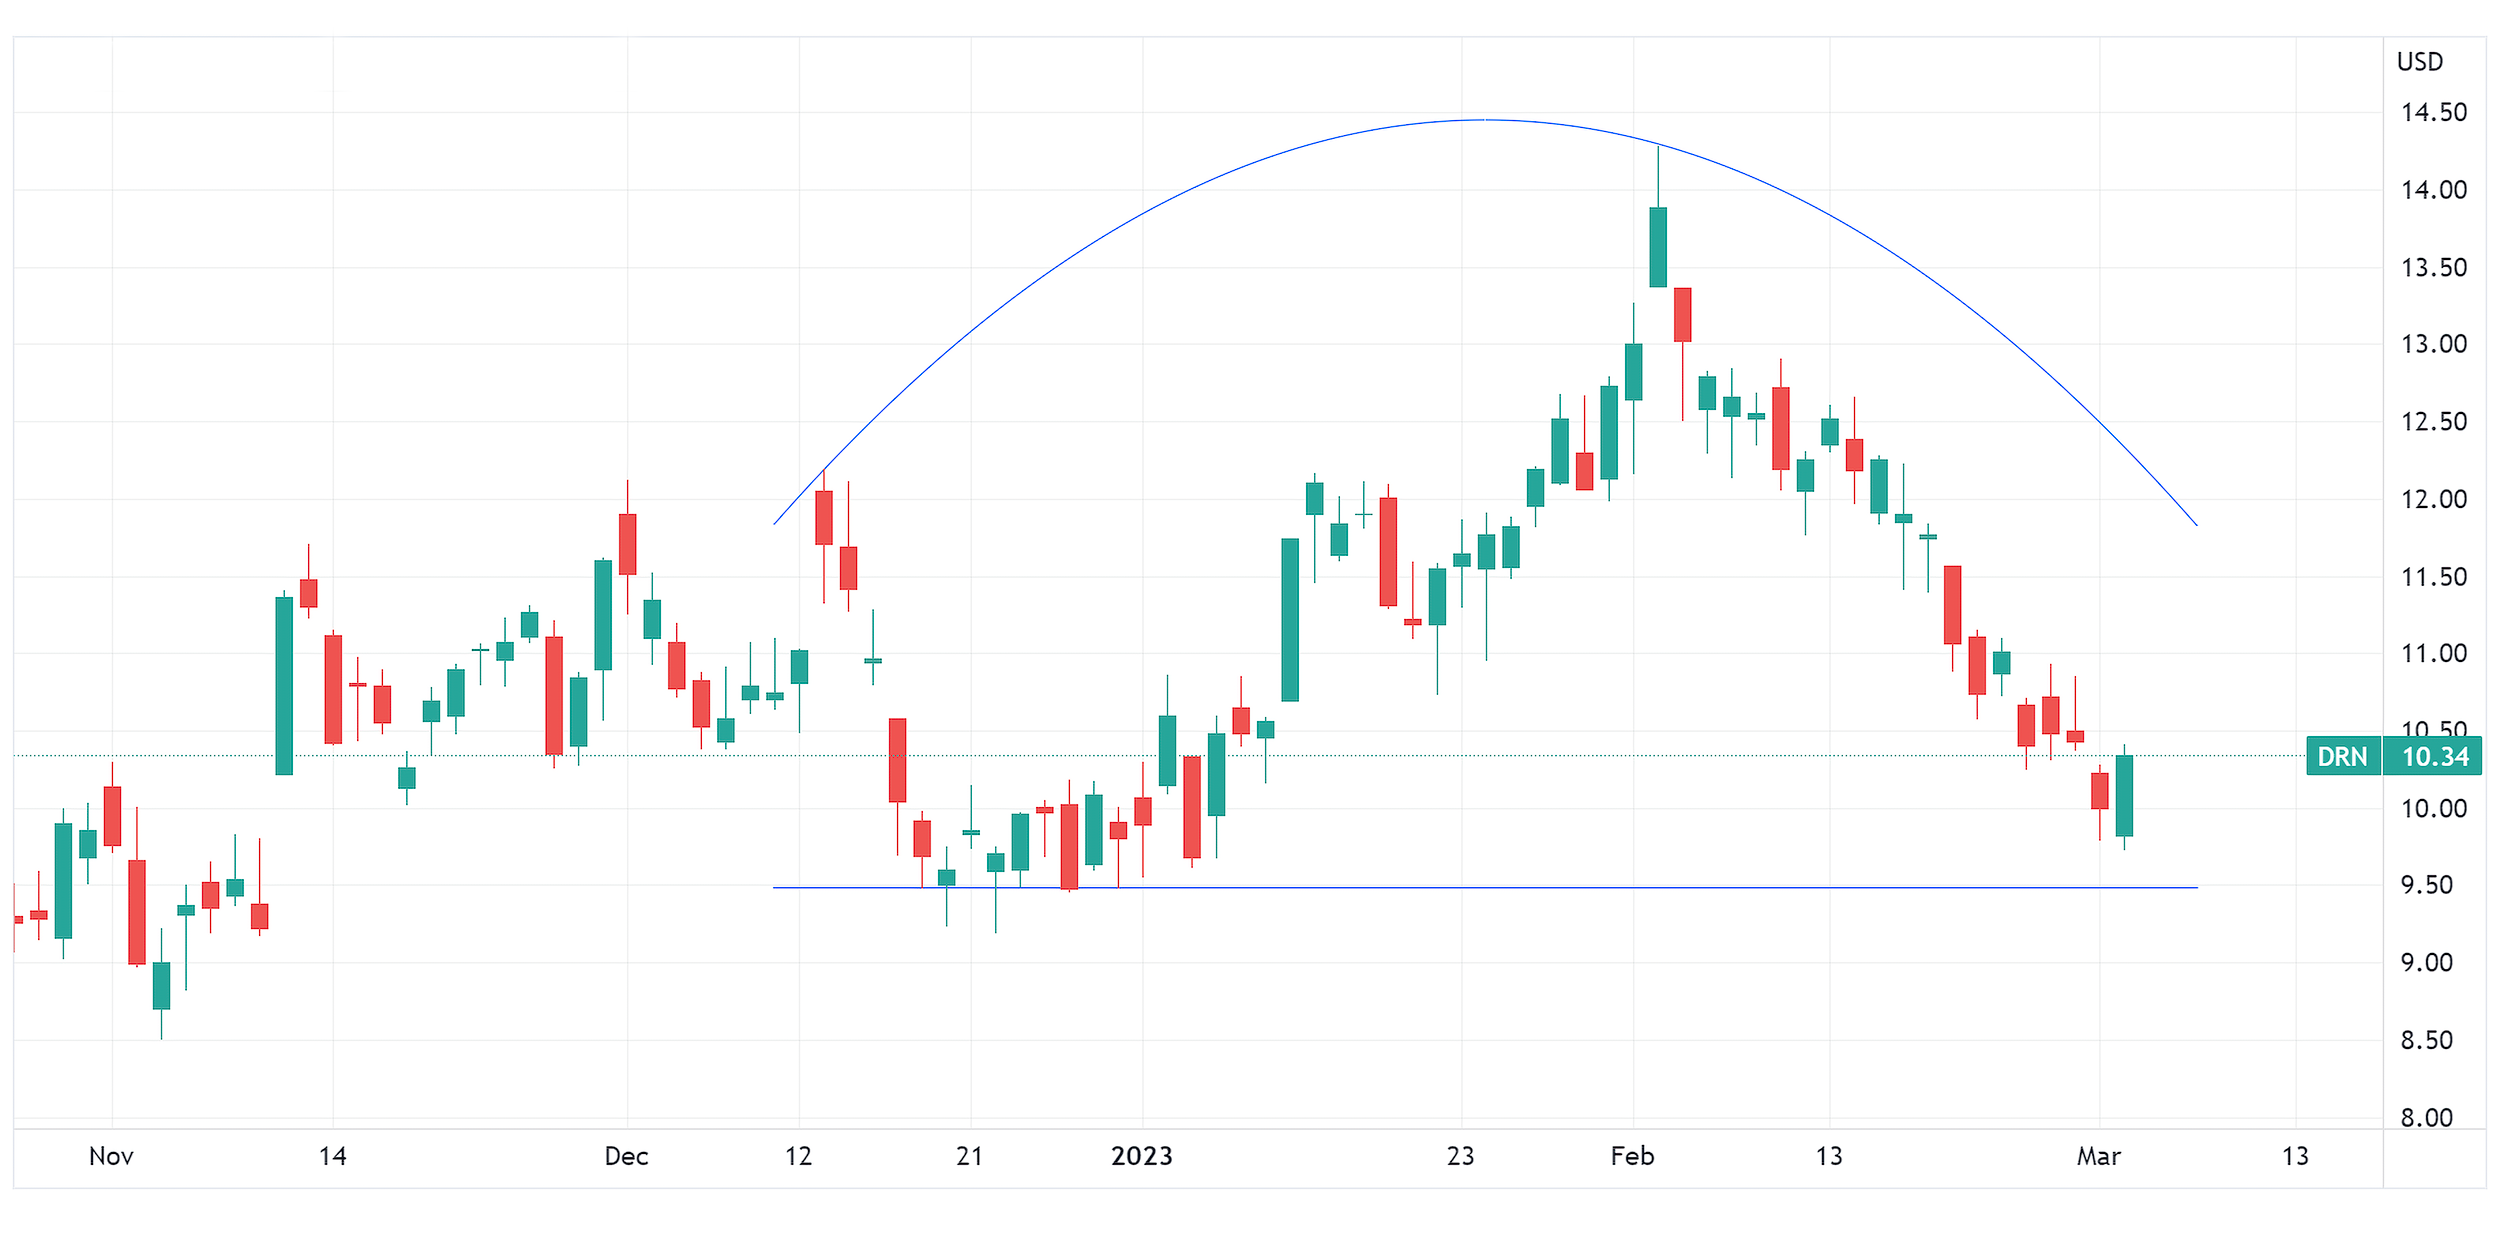
Source: TradingView.com
Candlestick charts display the high and low (the stick) and the open and close price (the body) of a security for a specific period. If the body is filled, it means the close was lower than the open. If the body is empty, it means the close was higher than the open.
The performance data quoted represents past performance. Past performance does not guarantee future results. The investment return and principal value of an investment will fluctuate. An investor’s shares, when redeemed, may be worth more or less than their original cost; current performance may be lower or higher than the performance quoted. For the most recent month-end performance go to Direxion.com/etfs. For standardized performance click here.
For traders looking to trade on the new home segment of real estate via homebuilders, Direxion even offers the Daily Homebuilders & Supplies Bull 3X Shares (Ticker: NAIL), which seeks to track 300%, before fees and expenses, of the daily performance of the Dow Jones U.S. Select Home Construction Index*.
What if Cash Flow Dries Up?
Despite the hard asset characteristics of real estate, it’s still a highly leveraged market, with many players relying on timely rent and lease payments from tenants. Inflation has a tendency to squeeze cash flow, which raises the risk that rents aren’t paid on time.
There’s also the labor market component which impacts real estate demand. So far, jobs numbers have remained fairly strong even as the Fed has tried to reduce demand by raising rates. But if layoffs start to accelerate notably, we could finally see real estate demand drop, which would potentially leave landlords exposed to unpaid rents. There are employment reports set to be released on March 10 so if traders see an uptick in unemployment, it could potentially lead to more short-term selling in real estate assets.
In such a scenario, Direxion’s Daily Real Estate Bear 3X Shares (Ticker: DRV), which seeks to track 300% of the inverse (or opposite) of the daily performance of the Real Estate Sector Select Index*, may be of interest to traders.
Below is a daily chart of DRV as of March 2, 2023.
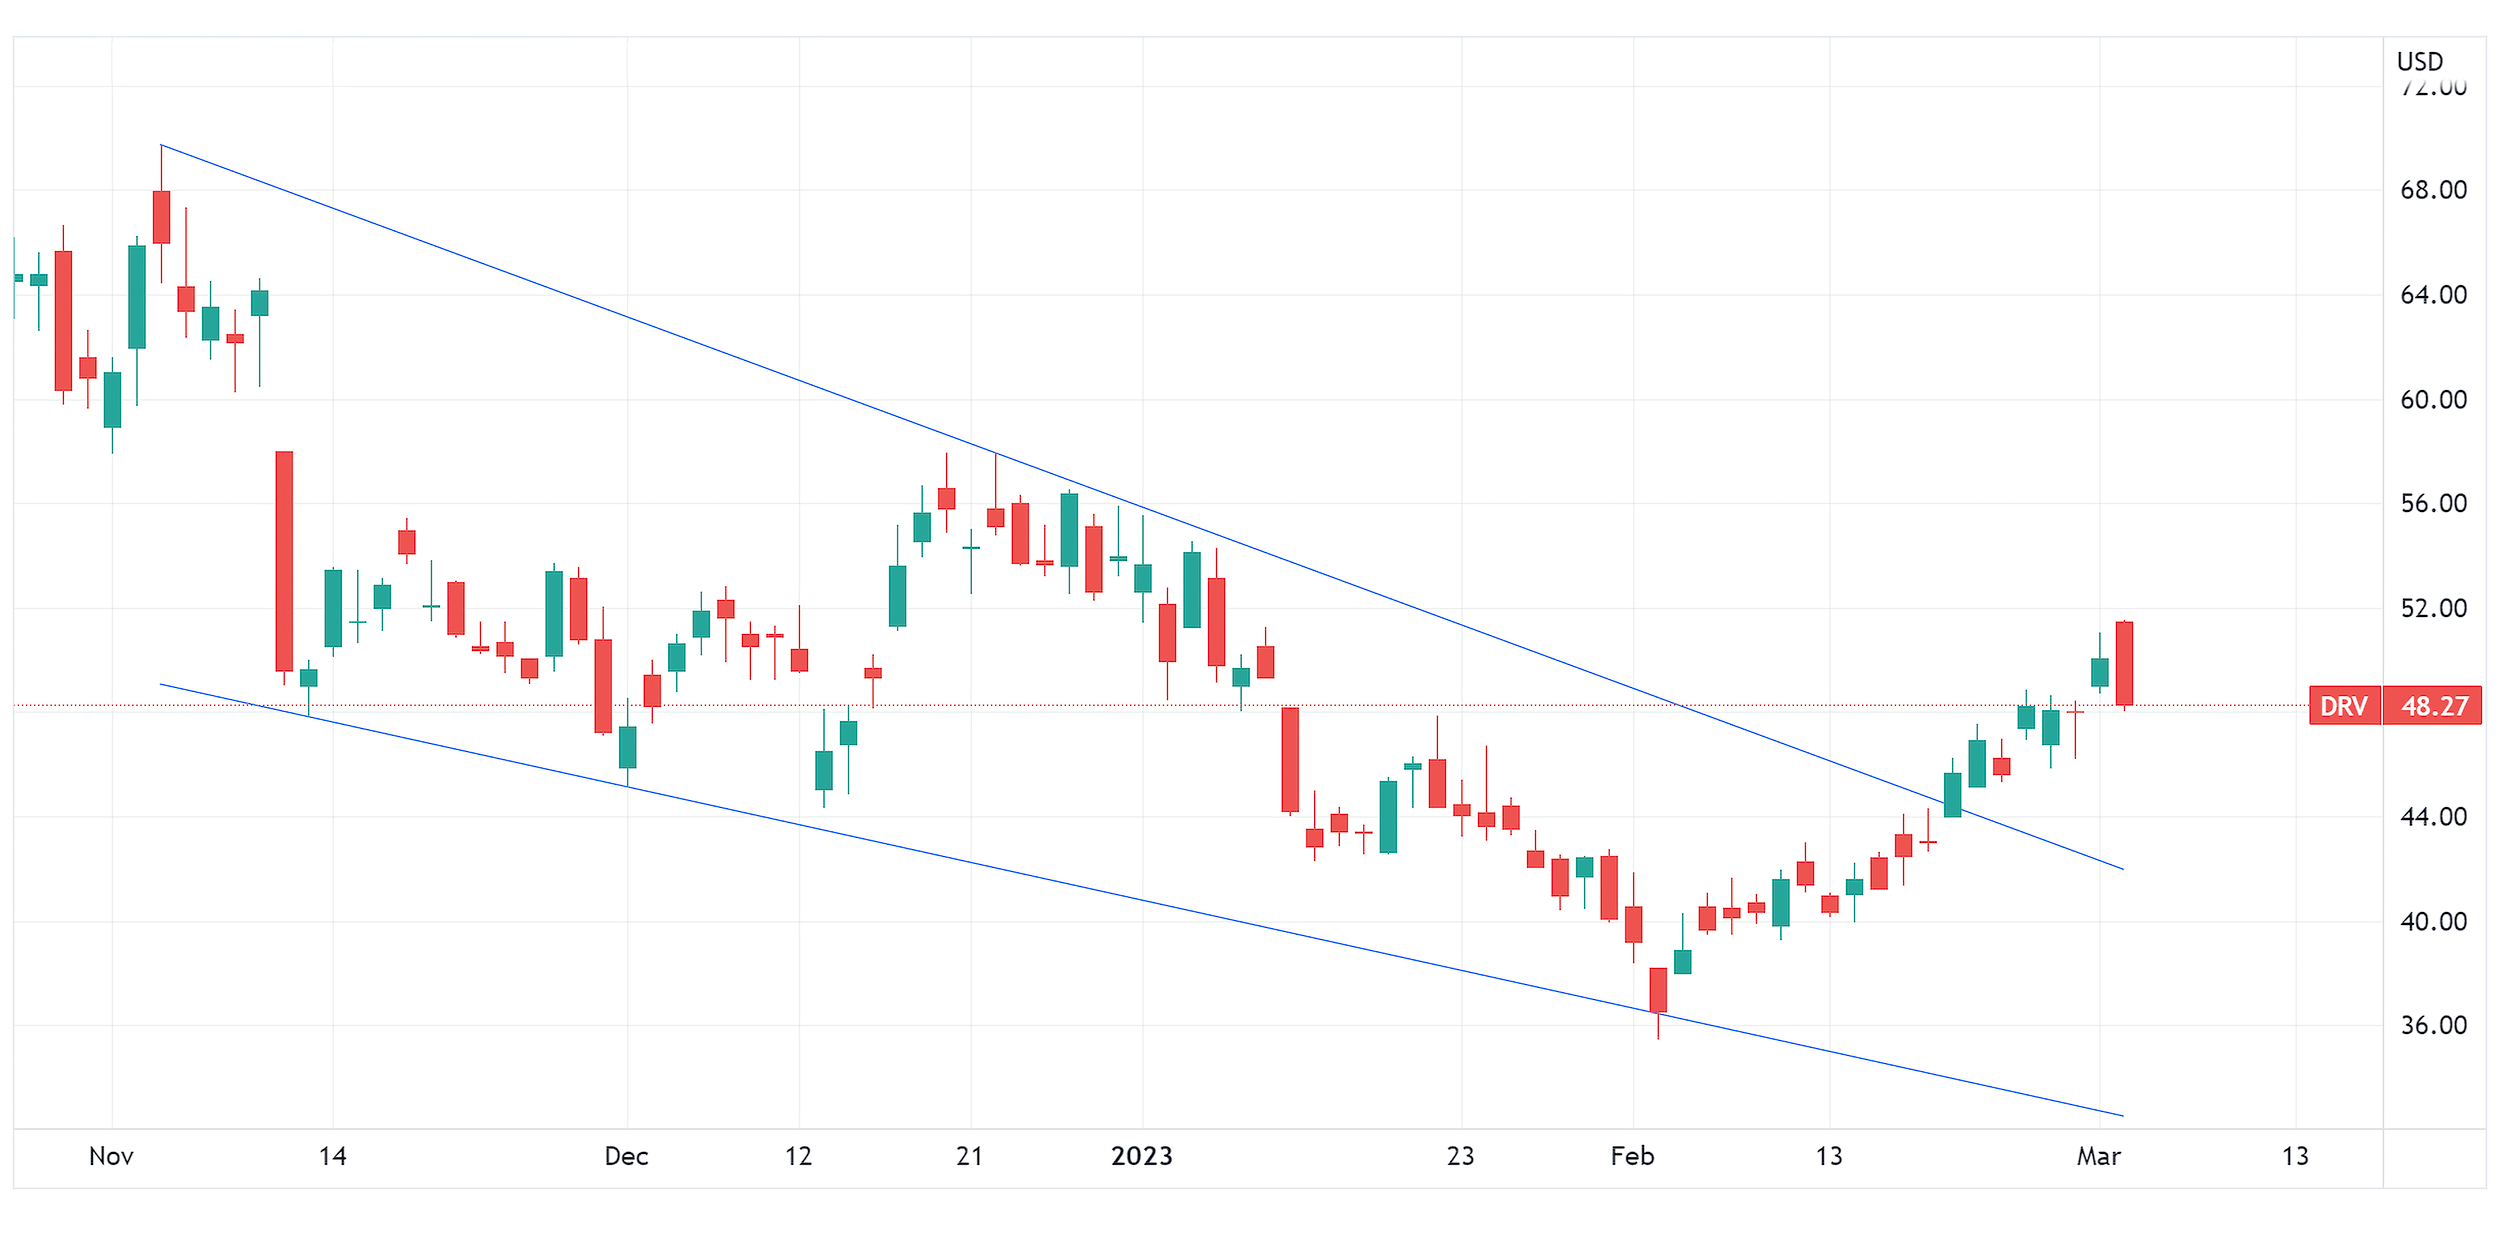
Source: TradingView.com
Candlestick charts display the high and low (the stick) and the open and close price (the body) of a security for a specific period. If the body is filled, it means the close was lower than the open. If the body is empty, it means the close was higher than the open.
The performance data quoted represents past performance. Past performance does not guarantee future results. The investment return and principal value of an investment will fluctuate. An investor’s shares, when redeemed, may be worth more or less than their original cost; current performance may be lower or higher than the performance quoted. For the most recent month-end performance go to Direxion.com/etfs. For standardized performance click here.
What’s in DRN and DRV?
Mainly REITs (real estate investment trusts). The top-holdings in the funds as of December 31, 2022, include Prologis (Ticker: PLD)(11.96%), American Tower, Class A (Ticker: AMT) (11.33%), and Equinix (Ticker: EQIX) (6.96%). PLD will report its Q1 earnings results on April 18, while AMT and EQIX will report their results on April 26. A stronger-than-expected result for any of these holdings could turn out to be beneficial for DRN, but if they come in below estimates, or the companies issue lower forward guidance, we could see DRV catch a bid instead.
The Real Estate Sector Index is provided by S&P Dow Jones Indices and includes securities of companies from the following industries: real estate management and development and real estate investment trusts (“REITs”), excluding mortgage REITs.
The Dow Jones U.S. Select Home Construction Index measures U.S companies in the home construction sector that provide a wide range of products and services related to homebuilding, including home construction and producers, sellers and suppliers of building materials, furnishings and fixtures and also home improvement retailers. The Index may include large-, mid- or small-capitalization companies.
One cannot directly invest in an index.
The Real Estate Sector Index and Dow Jones U.S. Select Home Construction Index are products of S&P Dow Jones Indices LLC ("SPDJI"), and have been licensed for use by Rafferty Asset Management, LLC ("Rafferty"). Standard & Poor’s® and S&P® are registered trademarks of Standard & Poor’s Financial Services LLC ("S&P"); Dow Jones® is a registered trademark of Dow Jones Trademark Holdings LLC ("Dow Jones"); and these trademarks have been licensed for use by SPDJI and sublicensed for certain purposes by Rafferty. Rafferty’s ETFs are not sponsored, endorsed, sold or promoted by SPDJI, Dow Jones, S&P, their respective affiliates and none of such parties make any representation regarding the advisability of investing in such product(s) nor do they have any liability for any errors, omissions, or interruptions of the Real Estate Select Sector Index or Dow Jones U.S. Select Home Construction Index.
An investor should carefully consider a Fund’s investment objective, risks, charges, and expenses before investing. A Fund’s prospectus and summary prospectus contain this and other information about the Direxion Shares. To obtain a Fund’s prospectus and summary prospectus call 866-476-7523 or visit our website at www.direxion.com. A Fund’s prospectus and summary prospectus should be read carefully before investing.
Leveraged and Inverse ETFs pursue daily leveraged investment objectives which means they are riskier than alternatives which do not use leverage. They seek daily goals and should not be expected to track the underlying index over periods longer than one day. They are not suitable for all investors and should be utilized only by sophisticated investors who understand leverage risk and who actively manage their investments.
Direxion Shares Risks – An investment in each Fund involves risk, including the possible loss of principal. Each Fund is non-diversified and includes risks associated with the Funds concentrating their investments in a particular industry, sector, or geographic region which can result in increased volatility. The use of derivatives such as futures contracts and swaps are subject to market risks that may cause their price to fluctuate over time. Risks of each Fund include Effects of Compounding and Market Volatility Risk, Leverage Risk, Market Risk, Counterparty Risk, Rebalancing Risk, Intra-Day Investment Risk, Other Investment Companies (including ETFs) Risk, Cash Transaction Risk, Tax Risk, and risks specific to the securities of the Real Estate Sector. Real estate securities are subject to risks similar to those associated with direct ownership of real estate, including changes in local and general economic conditions, supply and demand, interest rates, environmental liability, zoning laws, regulatory limitations on rent, property taxes, operating expenses and losses from casualty or condemnation. Additional risks include, for the Direxion Daily Real Estate Bull 3X Shares, Daily Index Correlation Risk, and for the Direxion Daily Real Estate Bear 3X Shares, Daily Inverse Index Correlation Risk, and risks related to Shorting. Please see the summary and full prospectuses for a more complete description of these and other risks of each Fund.
Distributor: Foreside Fund Services, LLC.