Will Tech Rebound After a Dismal 2022?

Editor's note: Any and all references to time frames longer than one trading day are for purposes of market context only, and not recommendations of any holding time frame. Daily rebalancing ETFs are not meant to be held unmonitored for long periods. If you don't have the resources, time or inclination to constantly monitor and manage your positions, leveraged and inverse ETFs are not for you.
Technology was one of the worst-performing sectors in the S&P 500 Index in 2022. This underperformance created a major headwind for equity indices, as tech is the largest sector in terms of market capitalization. Perhaps the greatest challenge the sector grappled with from a macroeconomic level was a meteoric rise in inflation, but as the Consumer Price Index (CPI)* appears to imply that inflationary pressures have peaked, could a rebound be in store for tech in Q1?
Will Earnings Season Spark Tech Stocks?
2022’s Q4 earnings season is around the corner, and it could turn out to be a pivotal one for the tech sector. Reports that numerous tech companies are laying off employees continue to come in, including Amazon, Inc., Meta Platforms, Inc., and Alphabet Inc. But an improving macro environment and the potential for an upside surprise in earnings could see much of the sector’s woes evaporate. Not to mention, markets have a tendency to discount future events, so tech’s margin contractions may already be priced in.
Tech bulls may want to consider investment options in Direxion’s Daily Technology Bull 3X Shares (Ticker: TECL), which seeks daily investment results, before fees and expenses, of 300% of the performance of the Technology Select Sector Index.*
The fund’s top holdings (as of 12/31/22) include Apple Inc. (Ticker: AAPL) [23.31%], Microsoft Corporation (Ticker: MSFT) [22.72%], and NVIDIA Corporation (Ticker: NVDA) [3.98%]*. Apple’s next earnings report is February 2, and analysts expect an earnings per share (EPS)* of $1.93. Microsoft’s next earnings report is January 24, and analysts expect an EPS of $2.29. Nvidia’s upcoming earnings report is February 15, and analysts expect an EPS of $0.48. An upside surprise in any of these companies could turn out to be a bullish catalyst for TECL however there is no guarantee it will translate to positive fund performance. Holdings are subject to risk and change. For a full list of TECL fund holdings, please click here.
Below is a daily chart of TECL as of January 12, 2023.
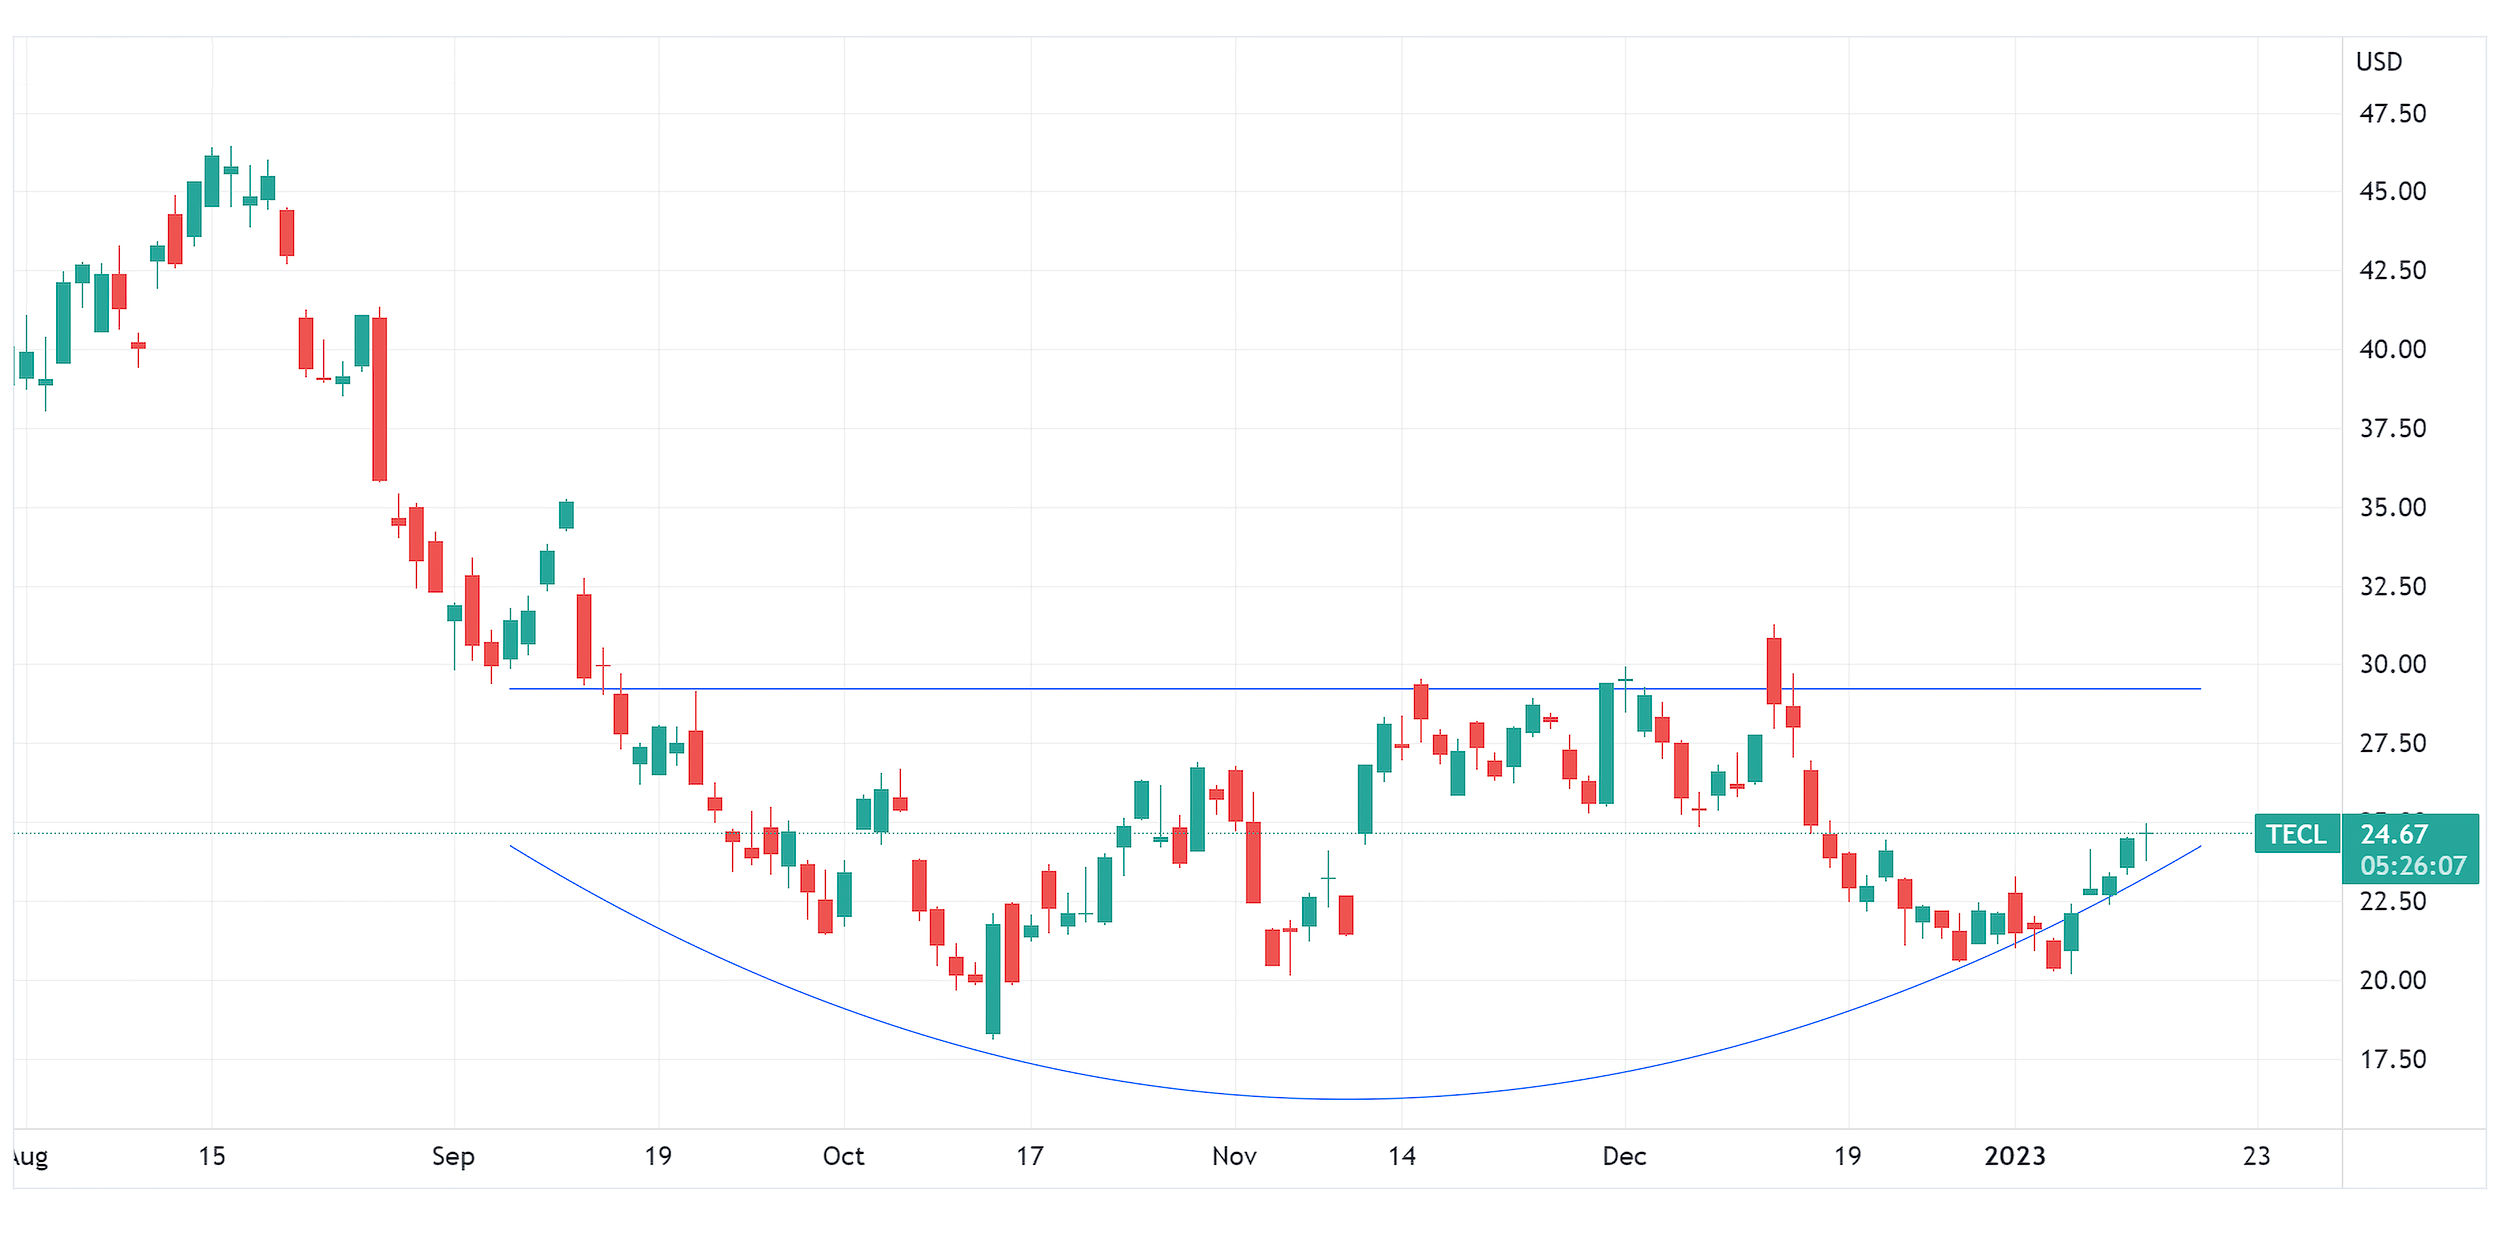
Source: TradingView.com
Candlestick charts display the high and low (the stick) and the open and close price (the body) of a security for a specific period. If the body is filled, it means the close was lower than the open. If the body is empty, it means the close was higher than the open.
The performance data quoted represents past performance. Past performance does not guarantee future results. The investment return and principal value of an investment will fluctuate. An investor’s shares, when redeemed, may be worth more or less than their original cost; current performance may be lower or higher than the performance quoted. For the most recent month-end performance go to Direxion.com/etfs. For standardized performance click here.
What if Inflation Rears Its Ugly Head Again?
We believe that the biggest risk tech faces in the next few months is a reversion back to the macroeconomic environment that plagued the sector in 2022. Ever since inflationary pressures started to cool, the Fed has been able to slow the pace of its rate hikes.
Many tech companies saw margins compress as the cost of capital increased last year, and generally speaking, tech performs when inflation is lower. When input costs rise too quickly, it forces companies to raise prices, and consumers inevitably adapt and change their behavior.
Traders looking to bet on the bearish outlook for tech may consider Direxion’s Daily Technology Bear 3X Shares (Ticker: TECS), which seeks daily investment results, before fees and expenses, of 300% of the inverse (or opposite), of the Technology Select Sector Index.
Below is a daily chart of TECS as of January 12, 2023.
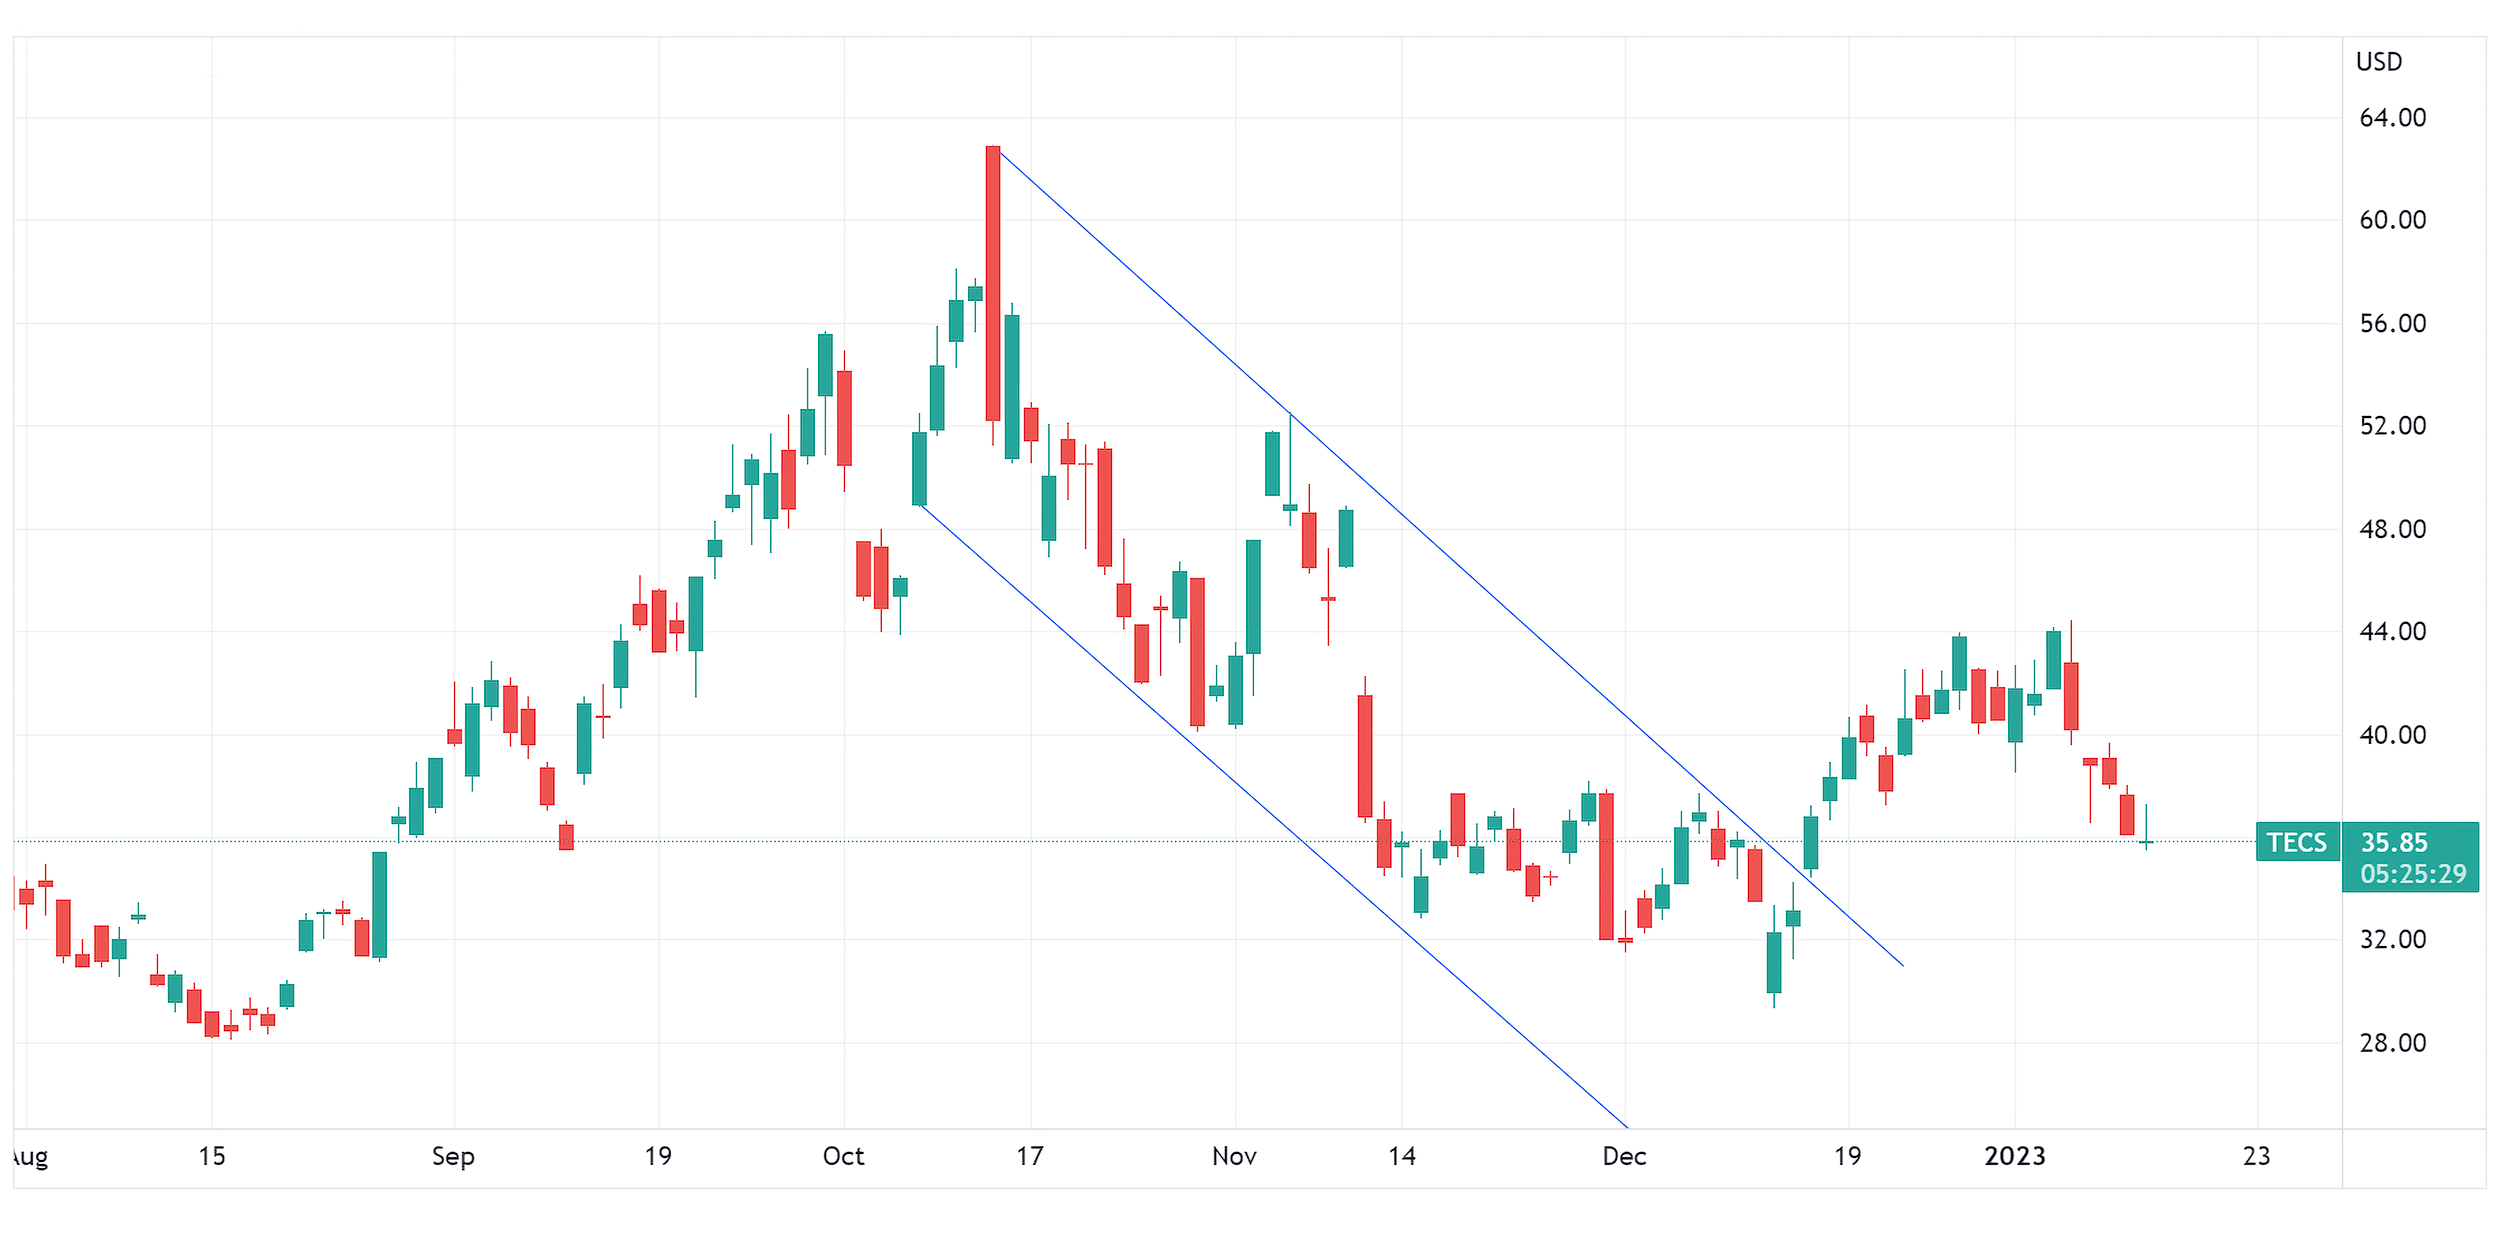
Source: TradingView.com
Candlestick charts display the high and low (the stick) and the open and close price (the body) of a security for a specific period. If the body is filled, it means the close was lower than the open. If the body is empty, it means the close was higher than the open.
The performance data quoted represents past performance. Past performance does not guarantee future results. The investment return and principal value of an investment will fluctuate. An investor’s shares, when redeemed, may be worth more or less than their original cost; current performance may be lower or higher than the performance quoted. For the most recent month-end performance go to Direxion.com/etfs. For standardized performance click here.
Alternative Tech Plays
Technology is an expansive and growing sector, and Direxion offers additional funds for traders looking to speculate on niche opportunities in the space. The Daily Semiconductor Bull 3X Shares (Ticker: SOXL) and Daily Semiconductor Bear 3X Shares (Ticker: SOXS) seek daily investment results, before fees and expenses, of 300%, or 300% of the inverse (or opposite), respectively, of the performance of the ICE Semiconductor Index*. There’s also the Daily Dow Jones Internet Bull 3X Shares (Ticker: WEBL) and Daily Dow Jones Internet Bear 3X Shares (Ticker: WEBS), which seek daily investment results, before fees and expenses, of 300%, or 300% of the inverse (or opposite), respectively, of the performance of the Dow Jones Internet Composite Index.*
*Definitions
- Consumer Price Index (CPI) measures the average change in prices over time that consumers pay for a basket of goods and services.
- The Technology Select Sector Index (IXTTR) is provided by S&P Dow Jones Indices and includes domestic companies from the technology sector which includes the following industries: computers and peripherals; software; diversified telecommunications services; communications equipment; semiconductors and semi-conductor equipment; internet software and services; IT services; electronic equipment, instruments and components; wireless telecommunication services; and office electronics.
- Earnings per share (EPS) is a company's net profit divided by the number of common shares it has outstanding.
- ICE Semiconductor Index (ICESEMIT) is a rules-based, modified float-adjusted market capitalization-weighted index that tracks the performance of the thirty largest U.S. listed semiconductor companies.
- The Dow Jones Internet Composite Index (DJINETT) is provided by S&P Dow Jones Indices and includes companies that generate at least 50% of their annual sales/revenue from the internet as determined by the Index Provider. Additionally, each stock must have a minimum of three months’ trading history and a three month average market capitalization of at least $100 million. The Index consists of 40 stocks from two different sectors, internet commerce and internet services.
- S&P 500 Index: Standard & Poor’s® selects the stocks comprising the S&P 500® Index on the basis of market capitalization, financial viability of the company and the public float, liquidity and price of a company’s shares outstanding. The Index is a float-adjusted, market capitalization-weighted index. One cannot directly invest in an index.
One cannot directly invest in an index.
An investor should carefully consider a Fund’s investment objective, risks, charges, and expenses before investing. A Fund’s prospectus and summary prospectus contain this and other information about the Direxion Shares. To obtain a Fund’s prospectus and summary prospectus call 866-476-7523 or visit our website at www.direxion.com. A Fund’s prospectus and summary prospectus should be read carefully before investing.
Leveraged and Inverse ETFs pursue daily leveraged investment objectives which means they are riskier than alternatives which do not use leverage. They seek daily goals and should not be expected to track the underlying index over periods longer than one day. They are not suitable for all investors and should be utilized only by sophisticated investors who understand leverage risk and who actively manage their investments.
Direxion Shares Risks – An investment in each Fund involves risk, including the possible loss of principal. Each Fund is non-diversified and includes risks associated with the Funds’ concentrating their investments in a particular industry, sector, or geographic region which can result in increased volatility. The use of derivatives such as futures contracts and swaps are subject to market risks that may cause their price to fluctuate over time. Risks of each Fund include Effects of Compounding and Market Volatility Risk, Leverage Risk, Market Risk, Counterparty Risk, Rebalancing Risk, Intra-Day Investment Risk, Other Investment Companies (including ETFs) Risk, and risks specific to the Technology Sector. The value of stocks of information technology companies and companies that rely heavily on technology is particularly vulnerable to rapid changes in technology product cycles. Additional risks include, for the Direxion Daily Technology Bull 3X Shares, Daily Index Correlation Risk, and for the Direxion Daily Technology Bear 3X Shares, Daily Inverse Index Correlation Risk, and risks related to Shorting and Cash Transactions. Please see the summary and full prospectuses for a more complete description of these and other risks of each Fund.
Distributor: Foreside Fund Services, LLC.