Direxion Work From Home ETF
The Direxion Work From Home ETF seeks investment results, before fees and expenses, that track the Solactive Remote Work Index. There is no guarantee that the fund will achieve its stated investment objective.
WFH
Operational Updates
- 01/23/2024
Direxion's New ETF Alert Service. Get Price and Volume Alerts automatically via text message!
Set Up Your ETF Alerts Today
Documents & Downloads
The Direxion Work From Home ETF offers exposure to companies across four technology pillars, allowing investors to gain exposure to those companies that stand to benefit from an increasingly flexible work environment. The four pillars include Cloud Technologies, Cybersecurity, Online Project and Document Management, and Remote Communications. Companies are selected for inclusion in the index by ARTIS, a proprietary natural language processing algorithm, which uses key words to evaluate large volumes of publicly available information, such as annual reports, business descriptions and financial news.
- Uses advanced techniques to identify the 40 stocks accelerating greater adaption of remote work
- Offers exposure to four pillars, across established and emerging technologies at the core of ongoing enterprise spend, that power the ability to work from anywhere efficiently and effectively
- May be considered a satellite holding to complement other broader positions within a portfolio
Pricing & Performance
NAV and Market Price information as of 04/25/2024.
Net Asset Value (NAV)
Market Price Closing
| 1M | 3M | YTD | 1Y | 3Y | 5Y | 10Y | Since Inception | Expense Ratio* (Gross / Net%) | Inception Date | |
|---|---|---|---|---|---|---|---|---|---|---|
| WFH NAV | -2.31 | 3.78 | 3.78 | 24.78 | -5.48 | — | — | 4.11 | 0.45 / 0.45* | 06/25/2020 |
| WFH Market Close | -2.19 | 3.86 | 3.86 | 24.85 | -5.47 | — | — | 4.12 | 0.45 / 0.45* | 06/25/2020 |
As of March 31, 2024
The Primary Listing Exchange is the NYSE Arca, Inc.
*The Fund’s adviser, Rafferty Asset Management, LLC (“Rafferty”) has entered into an Operating Services Agreement with the Fund. Under this Operating Services Agreement, Rafferty has contractually agreed to pay all expenses of the Fund as long as it is the advisor of the Fund other than the following: management fees, Rule 12b-1 distribution and/or service fees, taxes, swap financing and related costs, dividends or interest on short positions, other interest expenses, brokerage commissions, expenses incurred in connection with any merger or reorganization, acquired fund fees and expenses, and extraordinary expenses. If these expenses were included, the expense ratio would be higher.
The performance data quoted represents past performance. Past performance does not guarantee future results. The investment return and principal value of an investment will fluctuate. An investor’s shares, when redeemed, may be worth more or less than their original cost. Current performance may be lower or higher than the performance quoted. Returns for performance under one year are cumulative, not annualized. For the most recent month-end performance please visit the fund’s website at direxion.com.
Short-term performance, in particular, is not a good indication of the fund’s future performance, and an investment should not be made based solely on returns. Because of ongoing market volatility, fund performance may be subject to substantial short-term changes. For additional information, see the fund’s prospectus.
Index Information
The Solactive Remote Work Index (SOLWFHN) is comprised of U.S. listed securities and American Depository Receipts (“ADRs”) of companies that provide products and services in at least one of the following business segments that facilitate the ability of people to work from home: remote communications, cyber security, online project and document management, and cloud computing technologies (“WFH Industries”). The Index consists of approximately 40 companies, namely, the top 10 ranked companies in each of the four WFH Industries. The Index is equal weighted at each semi-annual reconstitution and rebalance date. One cannot invest directly in an index.
Index Top Ten Holdings
| % of Total | |
|---|---|
| Alphabet Inc | 2.87% |
| Docusign Inc | 2.83% |
| Oracle | 2.79% |
| Ringcentral Inc | 2.69% |
| Xerox Holdings Corp | 2.68% |
| TD Synnex | 2.67% |
| Verizon Communications | 2.62% |
| Microsoft | 2.61% |
| Amazon.Com Inc | 2.60% |
| Servicenow | 2.57% |
Index Sector Weightings
| % of Total | |
|---|---|
| Information Technology | 79.82% |
| Communication Services | 17.59% |
| Consumer Discretionary | 2.60% |
Remote Work Trends By The Numbers
Trends toward a greater adoption of flexible work arrangements were already in motion prior to the COVD-19 pandemic, which has and may continue to accelerate adoption of technologies that enable remote work.
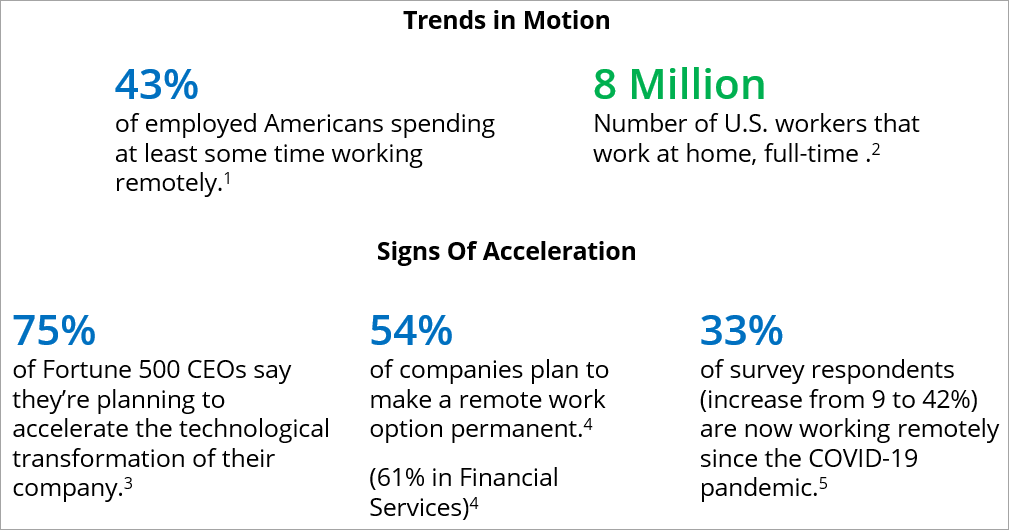
[1] Mann, and Adkins (2017): “America’s Coming Workplace: Home Alone”
[2] Kopf (2019): “Slowly but surely, working at home is becoming more common”
[3] Fortune (2020): “Fortune 500 CEO Poll”
[4] PwC (2020): “COVID-19 CFO Pulse Survey”
[5] CNBC/Change Research (2020): “States of Play”
Distributions
| Record Date | Ex Date | Pay Date | Income Dividend | Short-Term Capital Gain | Long-Term Capital Gain | Expand |
|---|---|---|---|---|---|---|
| 03/20/2024 | 03/19/2024 | 03/26/2024 | 0.03277 | — | — | |
| 12/22/2023 | 12/21/2023 | 12/29/2023 | 0.34044 | — | — | |
| 09/20/2023 | 09/19/2023 | 09/26/2023 | 0.02733 | — | — | |
| 12/21/2022 | 12/20/2022 | 12/28/2022 | 0.08898 | — | — | |
Record Date03/20/2024 Ex Date03/19/2024 Pay Date03/26/2024 Income Dividend0.03277 Short-Term Capital Gain— Long-Term Capital Gain— Record Date12/22/2023 Ex Date12/21/2023 Pay Date12/29/2023 Income Dividend0.34044 Short-Term Capital Gain— Long-Term Capital Gain— Record Date09/20/2023 Ex Date09/19/2023 Pay Date09/26/2023 Income Dividend0.02733 Short-Term Capital Gain— Long-Term Capital Gain— Record Date12/21/2022 Ex Date12/20/2022 Pay Date12/28/2022 Income Dividend0.08898 Short-Term Capital Gain— Long-Term Capital Gain— | ||||||
Documents
How to Buy
ETFs are generally available for purchase on exchanges, much like stocks—and can be bought and sold throughout the trading day whenever exchanges are open. Direxion ETFs cannot be purchased directly from Direxion, but are available for trading on most trading platforms.
We strongly recommend that you take the time to educate yourself on how ETFs function and behave in various market conditions before you endeavor to trade them in your account. It’s always a good idea to consult a financial advisor or brokerage account representative if you have questions about any ETFs.
Please note, your advisor or broker may charge commissions or other transaction fees. If you have any questions specific to Direxion products, please contact us direct at [email protected] or 866-476-7523.
Operational Updates
- 01/23/2024
Direxion's New ETF Alert Service. Get Price and Volume Alerts automatically via text message!
Set Up Your ETF Alerts Today
Documents & Downloads
How to Buy
While you can't purchase our funds from our website, investors still have multiple options for buying Direxion ETFs.
Learn More About Buying Direxion ETFs
Watch the Videos.
Subscribe to Newsletters & Operational Updates
Sign up for email and/or text of the important news, including:
- Fund updates including splits, distributions, launches, and other corporate actions
- Educational events, such as web seminars and conferences
- Our latest research and industry trends
Learn about Non-Leveraged ETFs
We have a wealth of articles and educational resources to provide investors with insights into economic and market events related to help inform your longer-term ETF investing.

The Spotlight Newsletter

Commodities COMmentary