Can Energy Tap the Well for More Gains?

Editor's note: Any and all references to time frames longer than one trading day are for purposes of market context only, and not recommendations of any holding time frame. Daily rebalancing ETFs are not meant to be held unmonitored for long periods. If you don't have the resources, time or inclination to constantly monitor and manage your positions, leveraged and inverse ETFs are not for you.
Energy stocks aren’t solely driven by the price of crude oil, but it’s certainly a factor for the sector’s direction. The sector has been in correction mode for almost a year as the price of crude oil backed off roughly 50% from its multi-year high in March 2022 (as of 7/20/23). The high corresponded with Russia’s invasion of Ukraine, and turned out to be a textbook example of, “Buy the rumor, sell the news.” Inflationary pressures have come down markedly over the past year, largely thanks to this decline. But will a new buying program in the Strategic Petroleum Reserve (SPR)* kick start a new rally in the sector?
Supply Cuts and Government Buyers: A Recipe for the Bulls?
Going back all the way to November 2022, The Organization of the Petroleum Exporting Countries (OPEC) has slowly and steadily cut oil production. Conventional economic theory teaches us that lower supply means higher prices, but these supply cuts have been marginal in terms of their effectiveness for kickstarting a rally.
Moreover, we have the Department of Energy starting to refill its Strategic Petroleum Reserve. Contracts were recently awarded to four companies to refill 3.2 million barrels of crude oil for an average of $73 per barrel. Keep in mind that the stockpile was drawn down to levels not seen since August 1983, so this is just the beginning of periodic purchases. Could this create a new floor in oil prices?
Traders that prefer the bullish outlook for energy markets may consider Direxion’s Daily Energy Bull 2X Shares (Ticker: ERX), which seeks daily investment results, before fees and expenses, of 200% of the daily performance of the Energy Select Sector Index1.
A few of the fund’s top holdings are slated to report their Q2 earnings results soon. These include Exxon Mobil Corporation (Ticker: XOM), Chevron Corporation (Ticker: CVX), and Schlumberger Limited (Ticker: SLB). Both Exxon and Chevron report on July 28, and analysts are looking for an earnings-per-share (EPS)* of $2.12 and $3.06, respectively. Any result that exceeds expectations could be a catalyst for a nice bid in ERX.
| INDEX TOP TEN HOLDINGS % AS OF 6/30/23 (HOLDINGS ARE SUBJECT TO CHANGE) | |
|---|---|
| Exxon | 22.84 |
| Chevon Texaco | 19.31 |
| Schlumberger | 4.93 |
| Conocophillips | 4.46 |
| EOG Resources | 4.40 |
| Marathon Petroleum | 3.91 |
| Pioneer National Resource | 3.82 |
| Phillips 66 | 3.46 |
| Valero Energy | 3.35 |
| Occidental U | 3.34 |
To view the fund’s full holdings, click here. Holdings are subject to risk and change.
Below is a daily chart of ERX as of July 21, 2023.
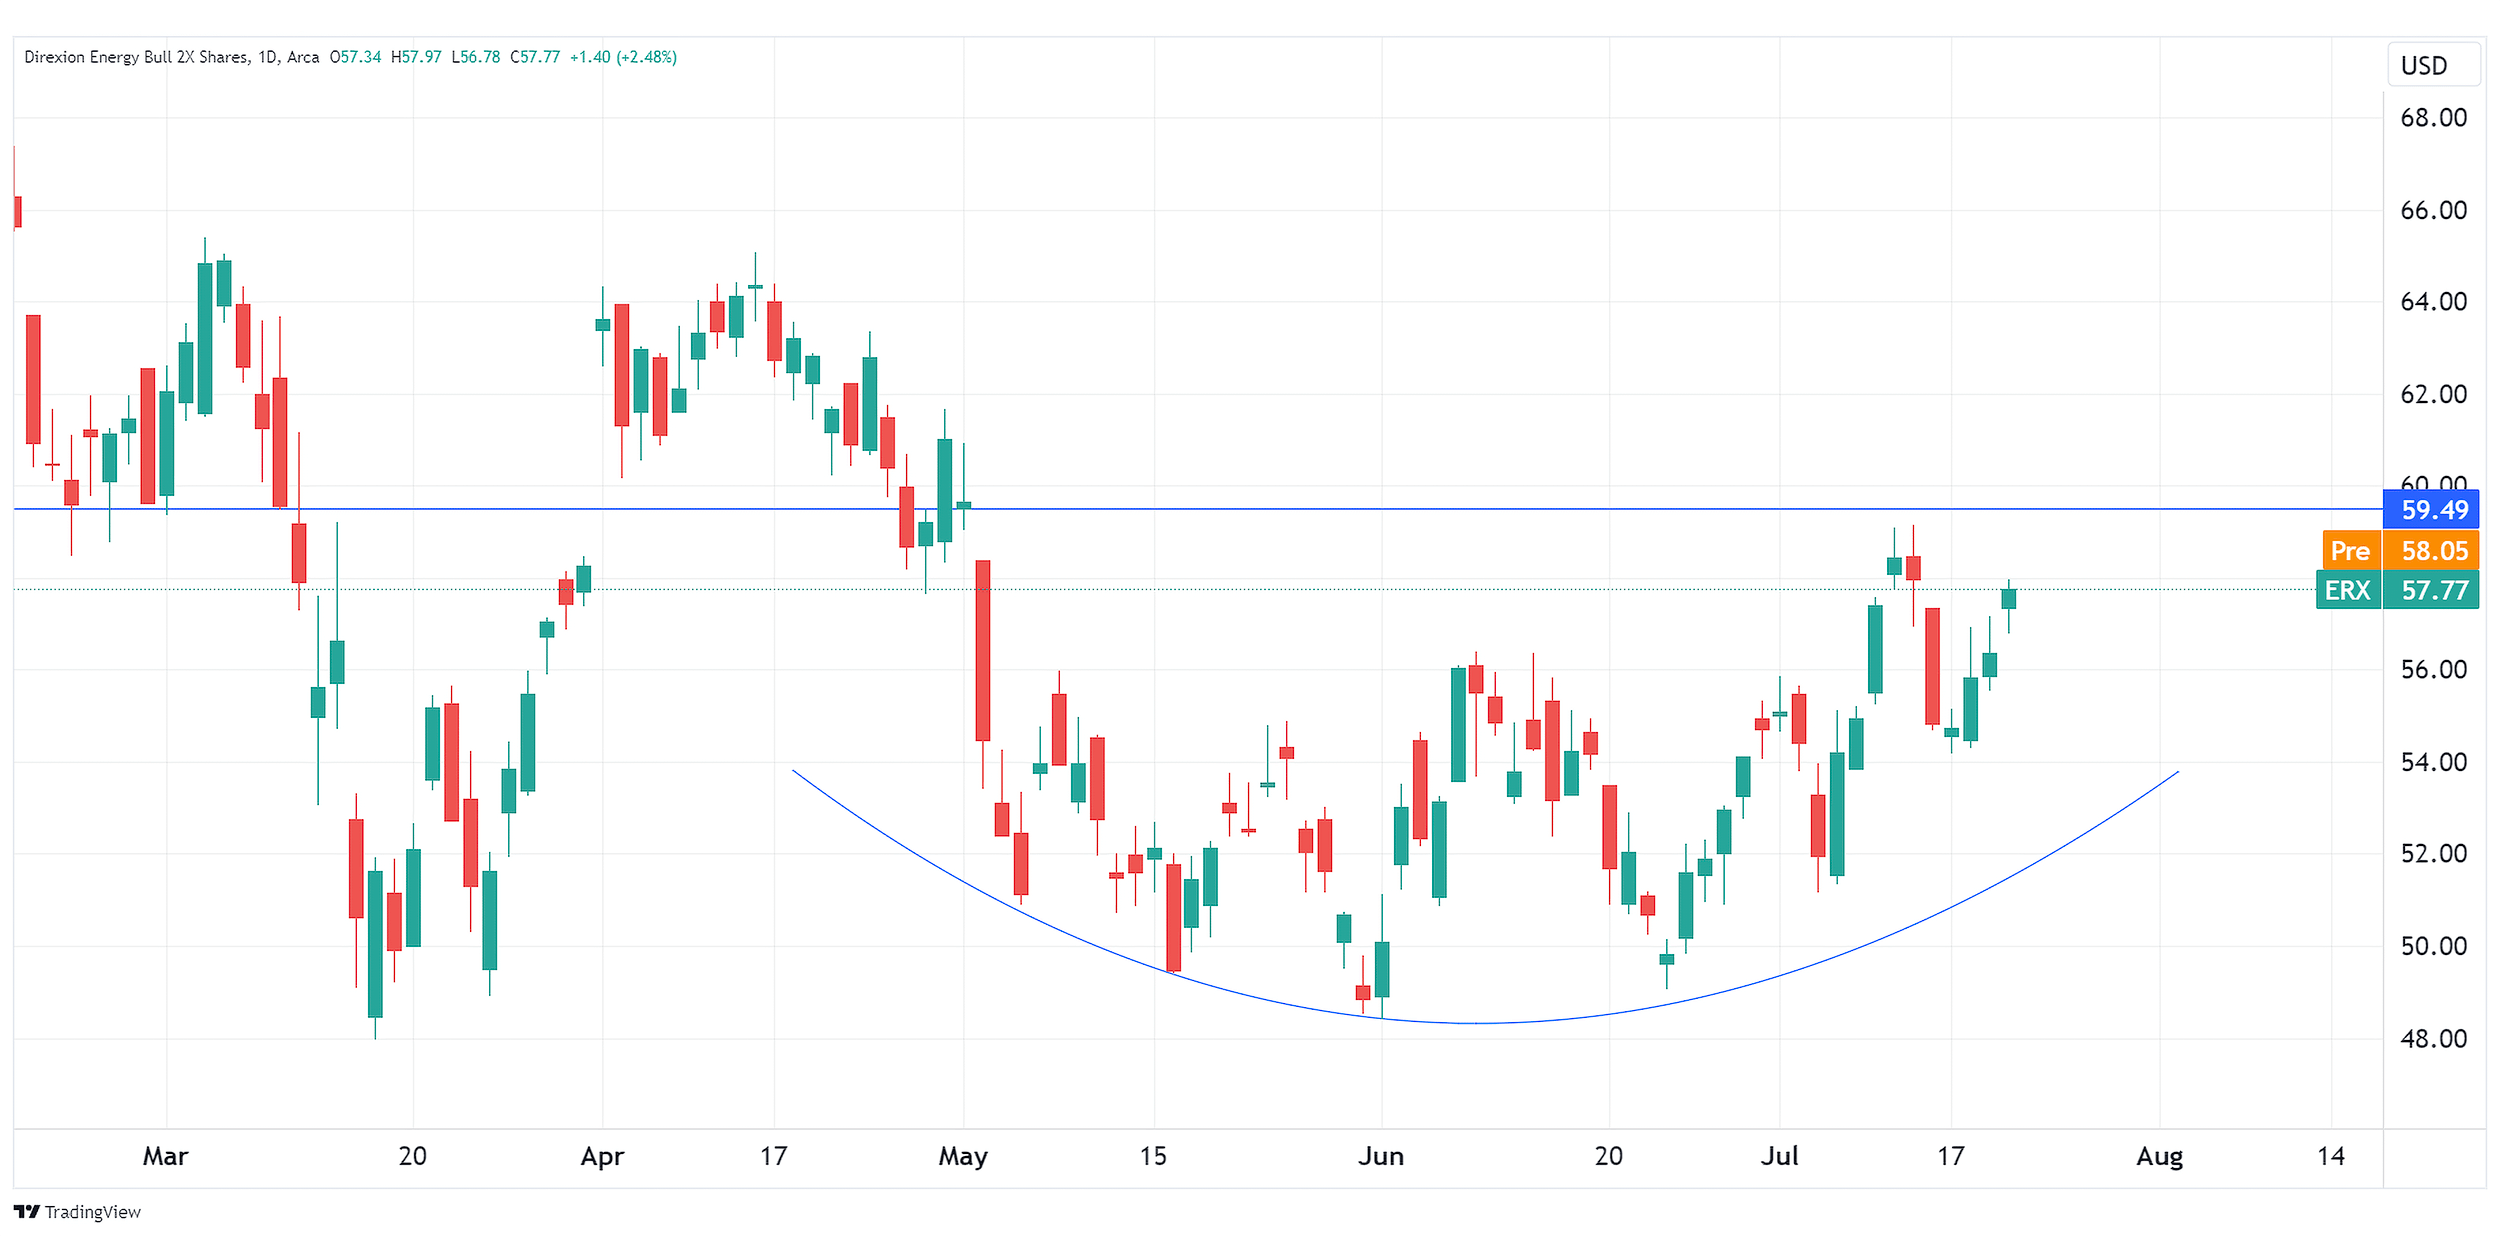
Source: TradingView.com
Candlestick charts display the high and low (the stick) and the open and close price (the body) of a security for a specific period. If the body is filled, it means the close was lower than the open. If the body is empty, it means the close was higher than the open.
The performance data quoted represents past performance. Past performance does not guarantee future results. The investment return and principal value of an investment will fluctuate. An investor’s shares, when redeemed, may be worth more or less than their original cost; current performance may be lower or higher than the performance quoted. For the most recent month-end performance go to Direxion.com/etfs. For standardized performance click here.
Could an Economic Slowdown Burn the Rally?
Not only do commodity markets respond to supply dynamics as discussed above, but also economic demand. Economic slowdowns typically bring with them lower commodity demand, which can potentially lead to lower prices.
Various economic metrics and data points have suggested that a recession could be coming down the pipeline. Of utmost note is the inverted yield curve, which has successfully forecasted the last eight economic slowdowns.
Additionally, the Federal Reserve seems keen on maintaining their rate hike trajectory despite inflationary pressures cooling. This hawkish environment is increasing financing costs, and making new energy exploration ventures much more competitive.
Traders that prefer the bearish outlook in energy may have an opportunity with Direxion’s Daily Energy Bear 2X Shares (Ticker: ERY), which seeks daily investment results, before fees and expenses, of 200% of the inverse (or opposite) of the daily performance of the Energy Select Sector Index.
Below is a daily chart of ERY as of July 21, 2023.
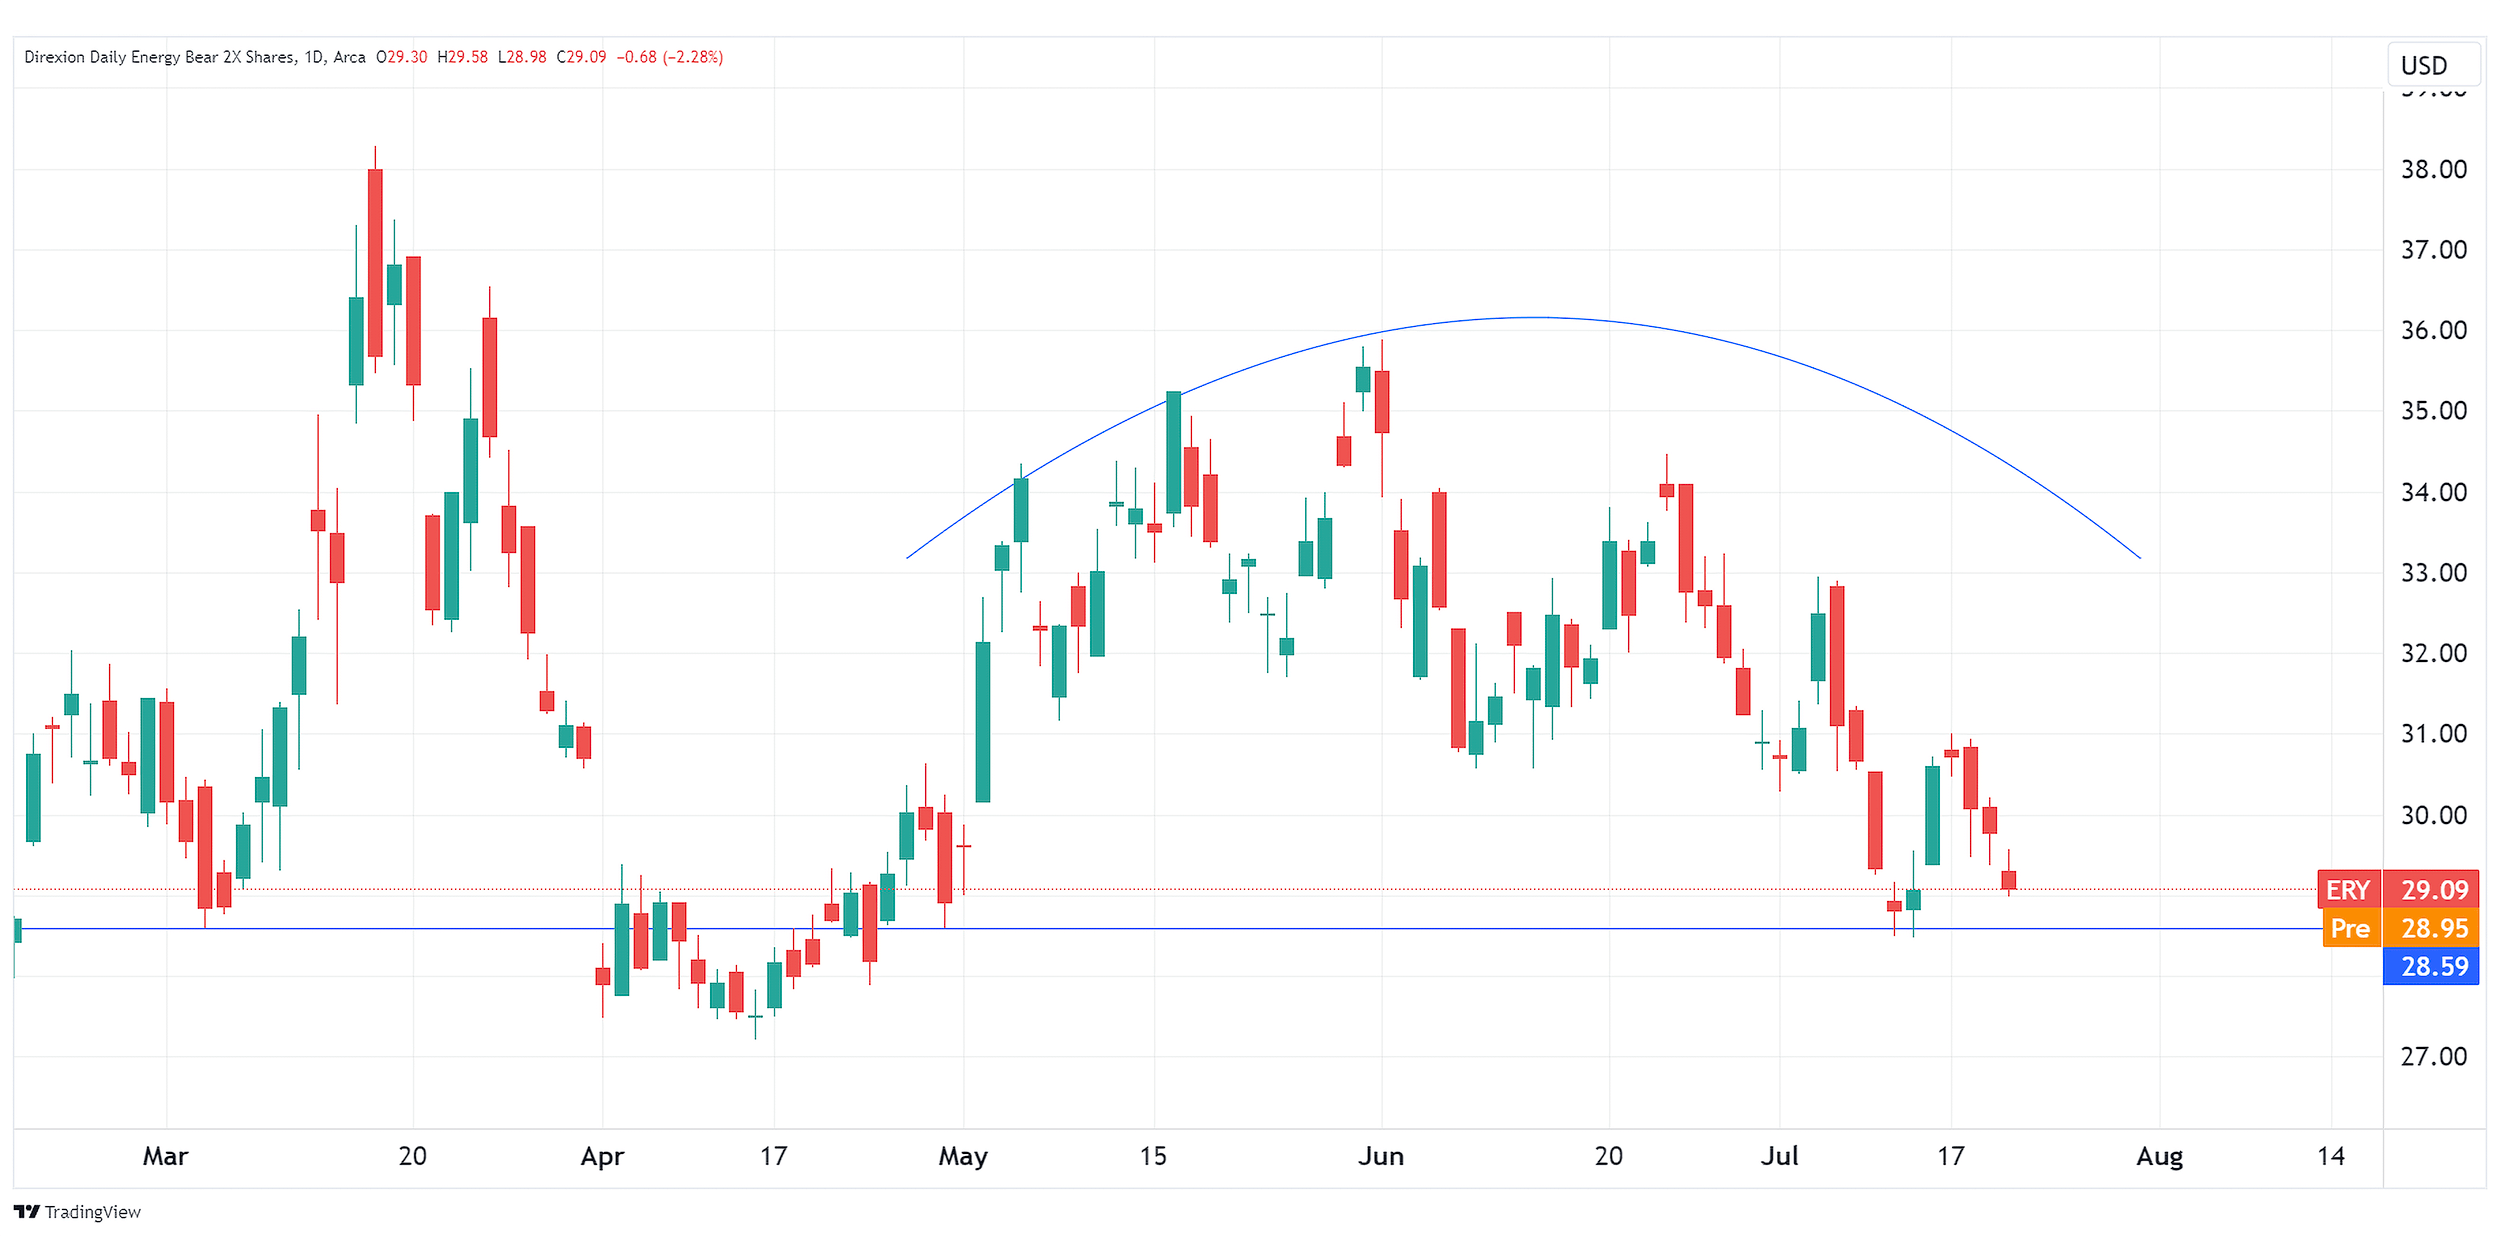
Source: TradingView.com
Candlestick charts display the high and low (the stick) and the open and close price (the body) of a security for a specific period. If the body is filled, it means the close was lower than the open. If the body is empty, it means the close was higher than the open.
The performance data quoted represents past performance. Past performance does not guarantee future results. The investment return and principal value of an investment will fluctuate. An investor’s shares, when redeemed, may be worth more or less than their original cost; current performance may be lower or higher than the performance quoted. For the most recent month-end performance go to Direxion.com/etfs. For standardized performance click here.
Diverse Commodity Plays
Traders seeking more concentrated plays in the energy sector may also find interest in Direxion’s Daily S&P Oil & Gas Exp. & Prod Bull 2X Shares (Ticker: GUSH) and Daily S&P Oil & Gas Exp. & Prod Bear 2X Shares (Ticker: DRIP). These ETFs seek daily investment results, before fees and expenses, of 200% or 200% of the inverse, respectively, of the daily performance of the S&P Oil & Gas Exploration & Production Select Industry Index2.
For those seeking to take on less risk, but still make an allocation to the commodity sector, there’s also the Direxion Auspice Broad Commodity Strategy ETF (Ticker: COM). This fund seeks to track the Auspice Broad Commodity Index3, which includes more than just energy and crude oil.
*Definitions and Index Descriptions
An investor should carefully consider a Fund’s investment objective, risks, charges, and expenses before investing. A Fund’s prospectus and summary prospectus contain this and other information about the Direxion Shares. To obtain a Fund’s prospectus and summary prospectus call 866-476-7523 or visit our website at www.direxion.com. A Fund’s prospectus and summary prospectus should be read carefully before investing.
Leveraged and Inverse ETFs pursue daily leveraged investment objectives which means they are riskier than alternatives which do not use leverage. They seek daily goals and should not be expected to track the underlying index over periods longer than one day. They are not suitable for all investors and should be utilized only by sophisticated investors who understand leverage risk and who actively manage their investments.
The “Energy Select Sector Index and S&P Oil & Gas Exploration & Production Select Industry Index” are each a product of S&P Dow Jones Indices LLC (“SPDJI”), and have been licensed for use by Rafferty Asset Management, LLC (“Rafferty”). Standard & Poor’s® and S&P® are registered trademarks of Standard & Poor’s Financial Services LLC (“S&P”); Dow Jones® is a registered trademark of Dow Jones Trademark Holdings LLC (“Dow Jones”); and these trademarks have been licensed for use by SPDJI and sublicensed for certain purposes by Rafferty. Rafferty’s ETFs are not sponsored, endorsed, sold or promoted by SPDJI, Dow Jones, S&P, their respective affiliates and none of such parties make any representation regarding the advisability of investing in such product(s) nor do they have any liability for any errors, omissions, or interruptions of the Energy Select Sector Index or the S&P Oil & Gas Exploration & Production Select Industry Index.
1The Energy Select Sector Index (IXETR) is provided by S&P Dow Jones Indices and includes domestic companies from the energy sector which includes the following industries: oil, gas and consumable fuels; and energy equipment and services.
2The S&P Oil & Gas Exploration & Production Select Industry Index (SPSIOPTR) is provided by S&P Dow Jones Indices, LLC and includes domestic companies from the oil and gas exploration and production sub-industry. The Index is a modified equal-weighted index that is designed to measure the performance of a sub-industry or group of sub-industries determined based on the Global Industry Classification Standards (GICS).
3The Auspice Broad Commodity Index (ABCERI) is a rules-based long/flat broad commodity index that seeks to capture the majority of the commodity upside returns, while seeking to mitigate downside risk. The Index is made up of a diversified portfolio of 12 commodities futures contracts (Silver, Gold, Copper, Heating Oil, Natural Gas, Gasoline, Crude Oil, Wheat, Soybeans, Corn, Cotton, and Sugar) that based on price trends can individually be Long or Flat (in Cash).
One cannot directly invest in an index.
Direxion Shares Risks – An investment in each Fund involves risk, including the possible loss of principal. Each Fund is non-diversified and includes risks associated with the Funds’ concentrating their investments in a particular industry, sector, or geographic region which can result in increased volatility. The use of derivatives such as futures contracts and swaps are subject to market risks that may cause their price to fluctuate over time. Risks of each Fund include Effects of Compounding and Market Volatility Risk, Leverage Risk, Market Risk, Counterparty Risk, Rebalancing Risk, Intra-Day Investment Risk, Other Investment Companies (including ETFs) Risk, Cash Transaction Risk, Tax Risk, and risks specific to investment in the securities of the Energy Sector. Companies that engage in energy-related businesses and companies primarily involved in the production and mining of coal, development and production of oil, gas and consumable fuels and provide drilling and other energy resources production and distribution related services are subject to risks of legislative or regulatory changes, adverse market conditions and/or increased competition affecting the energy sector. Additional risks include, for the Direxion Daily Energy Bull 2X Shares, Daily Index Correlation Risk, and for the Direxion Daily Energy Bear 2X Shares, Daily Inverse Index Correlation Risk, and risks related to Shorting. Please see the summary and full prospectuses for a more complete description of these and other risks of each Fund.
These funds track a commodity related equity index, consisting of a basket of energy related stocks. They do not invest in physical commodities and should not be expected to directly track the performance of energy related commodities.
Distributor: Foreside Fund Services, LLC.