
Editor's note: Any and all references to time frames longer than one trading day are for purposes of market context only, and not recommendations of any holding time frame. Daily rebalancing ETFs are not meant to be held unmonitored for long periods. If you don't have the resources, time or inclination to constantly monitor and manage your positions, leveraged and inverse ETFs are not for you.
Investing in the funds involves a high degree of risk. Unlike traditional ETFs, or even other leveraged and/or inverse ETFs, these leveraged and/or inverse single-stock ETFs track the price of a single stock rather than an index, eliminating the benefits of diversification. Leveraged and inverse ETFs pursue daily leveraged investment objectives, which means they are riskier than alternatives which do not use leverage. They seek daily goals and should not be expected to track the underlying stock’s performance over periods longer than one day. They are not suitable for all investors and should be utilized only by investors who understand leverage risk and who actively manage their investments. The Funds will lose money if the underlying stock’s performance is flat, and it is possible that the Bull Fund will lose money even if the underlying stock’s performance increases, and the Bear Fund will lose money even if the underlying stock’s performance decreases, over a period longer than a single day. An investor could lose the full principal value of his or her investment in a single day. Investing in the Funds is not equivalent to investing directly in each underlying security.
Just when you thought the markets were settling into summer vacation mode, along comes Earnings Season, and this one’s shaping up like the final level of a boss fight. Call it the Jedi Council of quarterly results. Or the final rose ceremony for Wall Street. Either way, Q2 2025 earnings are here to shake things up.
Starting the week of July 14 and peaking through early August, over 60% of the S&P 500’s market cap will report earnings, including heavyweights from the MAG7, Semiconductors, and more. If you're trading off momentum, reversals, or just living for the volatility, buckle up. This is your kind of ride.
Boss-Level Reporting Weeks
The fireworks begin July 17 with Taiwan Semiconductors Manufacturing Co. and Interactive Brokers, and hit turbo mode the week of July 22–26, when the likes of Tesla, Inc. and Meta Platforms, Inc. are expected to drop their results. But the real market-movers may come the following week, as Apple, Inc. and Amazon.com, Inc. step into the earnings arena.
As earning reports continue to emerge, traders should closely monitor sector-specific performances and corporate guidance to gauge the sustainability of earnings growth. Tariff-war fallout overlayed against elevated market valuations and cautious corporate outlooks suggest a bumpy landscape for U.S. equities in the near term.
Here’s a list of announcement dates with related Leveraged & Inverse ETFs, including Single Stock Daily LETFs, week-by-week for 2025’s Q2 earnings season.
Earnings dates are subject to change without notice.
Q1 2025 Earnings Season - % of Each Index Reporting by Week
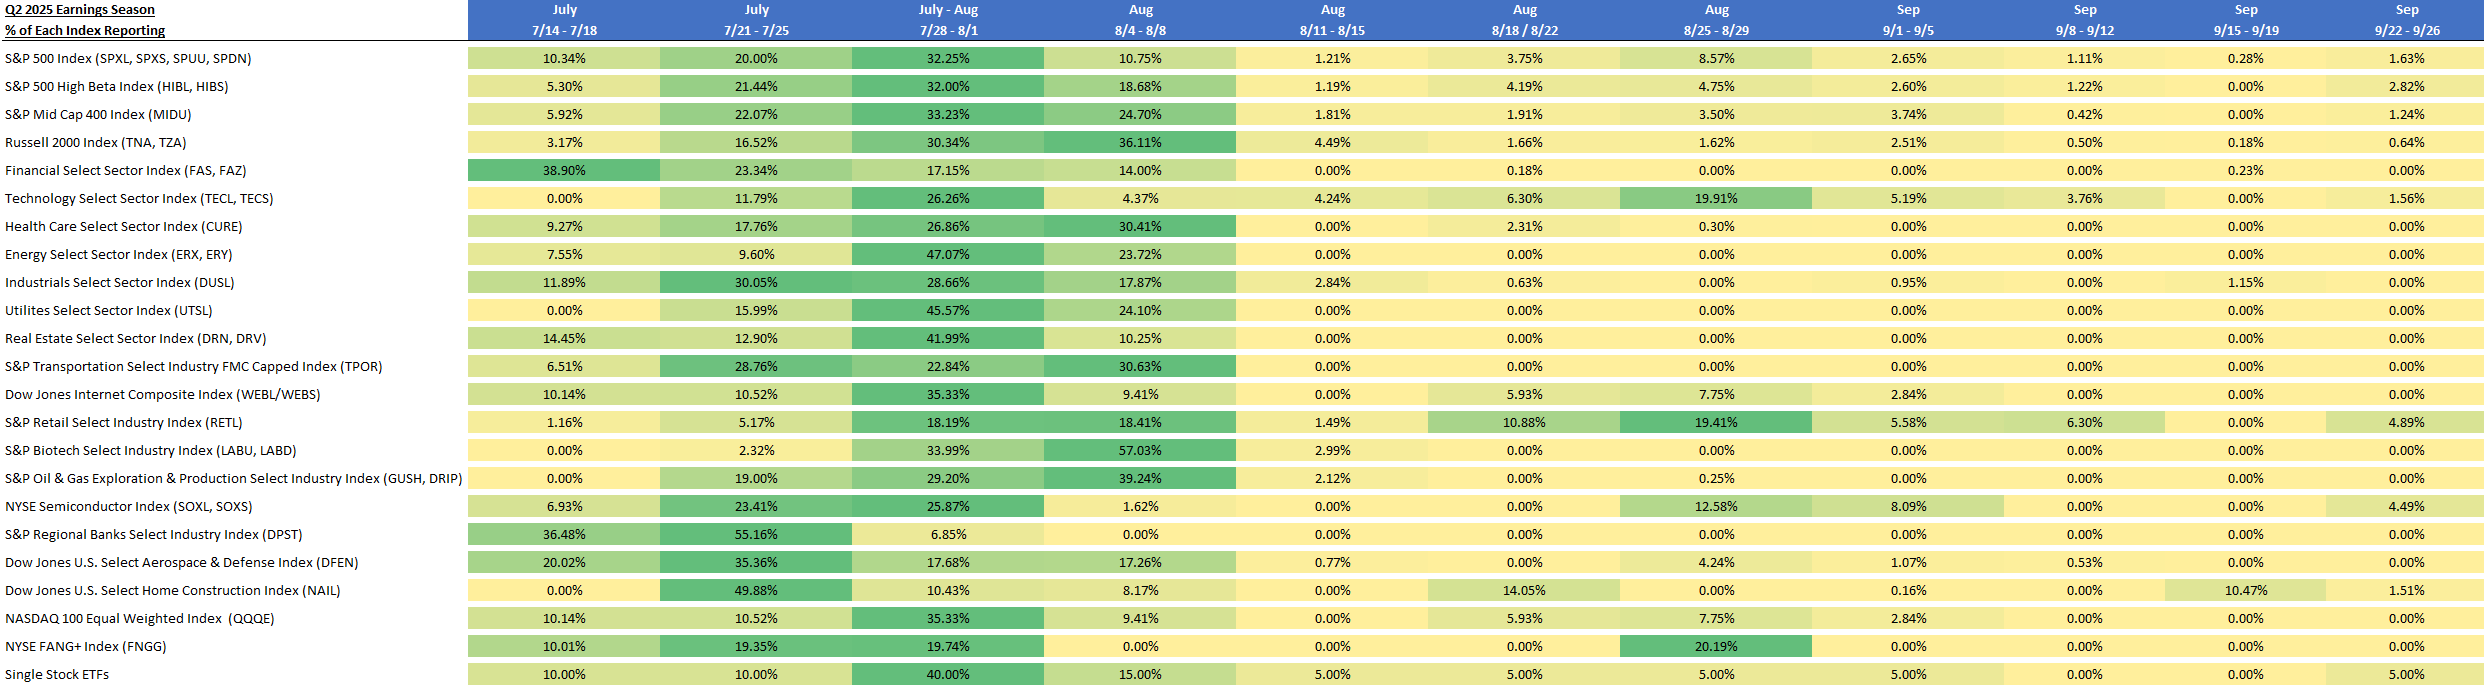
Source: Bloomberg Data Management Services. Figures represent percent of companies in each index expected to release earnings reports by week. Green shading identifies the week with the highest percentages. Index descriptions are provided at the end of the page.
Let Volatility Be Your Superpower
For traders looking to take risk on short-term moves, Direxion’s Daily Leveraged & Inverse ETFs can be the power-up you're looking for. Whether you’re bullish on Big Tech or eyeing a potential pullback in semiconductors, these ETFs give you the flexibility to act — fast.
So sharpen your charts, set your alerts, and keep your finger on the trigger. The earnings arena is open.
Significant risk involved.
S&P 500 Index
| Ticker | Name | Weight in the Index | Expected Earnings Release |
| NVDA UW | NVIDIA Corp | 7.32% | 8/27/2025 |
| MSFT UW | Microsoft Corp | 7.02% | 7/30/2025 |
| AMZN UW | Amazon.com Inc | 4.00% | 7/31/2025 |
| META UW | Meta Platforms Inc | 2.97% | 7/30/2025 |
| AVGO UW | Broadcom Inc | 2.47% | 9/5/2025 |
| GOOGL UW | Alphabet Inc | 1.95% | 7/23/2025 |
| BRK/B UN | Berkshire Hathaway Inc | 1.67% | 8/4/2025 |
| GOOG UW | Alphabet Inc | 1.58% | 7/23/2025 |
| TSLA UW | Tesla Inc | 1.56% | 7/23/2025 |
| JPM UN | JPMorgan Chase & Co | 1.54% | 7/15/2025 |
S&P 500 High Beta Index
| Ticker | Name | Weight in the Index | Expected Earnings Release |
| MCHP UW | Microchip Technology Inc | 1.76% | 8/1/2025 |
| MU UW | Micron Technology Inc | 1.72% | 9/25/2025 |
| SMCI UW | Super Micro Computer Inc | 1.70% | 8/6/2025 |
| VST UN | Vistra Corp | 1.62% | 8/8/2025 |
| NVDA UW | NVIDIA Corp | 1.57% | 8/27/2025 |
| ON UW | ON Semiconductor Corp | 1.56% | 7/29/2025 |
| MPWR UW | Monolithic Power Systems Inc | 1.54% | 8/1/2025 |
| AVGO UW | Broadcom Inc | 1.51% | 9/5/2025 |
| AMD UW | Advanced Micro Devices Inc | 1.47% | 8/5/2025 |
| PLTR UW | Palantir Technologies Inc | 1.46% | 8/4/2025 |
Financials Select Sector Index
| Ticker | Name | Weight in the Index | Expected Earnings Release |
| BRK/B UN | Berkshire Hathaway Inc | 11.86% | 8/4/2025 |
| JPM UN | JPMorgan Chase & Co | 10.95% | 7/15/2025 |
| V UN | Visa Inc | 8.22% | 7/23/2025 |
| MA UN | Mastercard Inc | 6.17% | 7/31/2025 |
| WFC UN | Wells Fargo & Co | 3.61% | 7/15/2025 |
| GS UN | Goldman Sachs Group Inc/The | 2.95% | 7/16/2025 |
| AXP UN | American Express Co | 2.42% | 7/18/2025 |
| MS UN | Morgan Stanley | 2.39% | 7/16/2025 |
| SPGI UN | S&P Global Inc | 2.25% | 7/31/2025 |
| C UN | Citigroup Inc | 2.21% | 7/15/2025 |
Health Care Select Sector Index
| Ticker | Name | Weight in the Index | Expected Earnings Release |
| LLY UN | Eli Lilly & Co | 12.44% | 8/7/2025 |
| JNJ UN | Johnson & Johnson | 7.66% | 7/16/2025 |
| UNH UN | UnitedHealth Group Inc | 5.66% | 7/29/2025 |
| MRK UN | Merck & Co Inc | 4.18% | 7/29/2025 |
| ISRG UW | Intuitive Surgical Inc | 3.95% | 7/22/2025 |
| TMO UN | Thermo Fisher Scientific Inc | 3.25% | 7/23/2025 |
| AMGN UW | Amgen Inc | 3.24% | 8/5/2025 |
| BSX UN | Boston Scientific Corp | 3.15% | 7/23/2025 |
| PFE UN | Pfizer Inc | 2.94% | 8/5/2025 |
| GILD UW | Gilead Sciences Inc | 2.84% | 8/8/2025 |
Industrials Select Sector Index
| Ticker | Name | Weight in the Index | Expected Earnings Release |
| GE UN | General Electric Co | 5.82% | 7/17/2025 |
| UBER UN | Uber Technologies Inc | 4.44% | 8/6/2025 |
| RTX UN | RTX Corp | 4.28% | 7/22/2025 |
| CAT UN | Caterpillar Inc | 4.07% | 8/5/2025 |
| BA UN | Boeing Co/The | 3.57% | 7/29/2025 |
| HON UW | Honeywell International Inc | 3.38% | 7/24/2025 |
| GEV UN | GE Vernova Inc | 3.16% | 7/23/2025 |
| UNP UN | Union Pacific Corp | 3.10% | 7/24/2025 |
| ETN UN | Eaton Corp PLC | 3.08% | 8/1/2025 |
| DE UN | Deere & Co | 2.84% | 8/14/2025 |
Real Estate Select Sector Index
| Ticker | Name | Weight in the Index | Expected Earnings Release |
| PLD UN | Prologis Inc | 9.21% | 7/16/2025 |
| WELL UN | Welltower Inc | 8.88% | 7/29/2025 |
| DLR UN | Digital Realty Trust Inc | 5.06% | 7/24/2025 |
| O UN | Realty Income Corp | 4.83% | 8/6/2025 |
| SPG UN | Simon Property Group Inc | 4.73% | 8/5/2025 |
| PSA UN | Public Storage | 4.30% | 7/30/2025 |
| CCI UN | Crown Castle Inc | 4.11% | 7/17/2025 |
| CBRE UN | CBRE Group Inc | 3.89% | 7/29/2025 |
| VICI UN | VICI Properties Inc | 3.25% | 7/30/2025 |
| CSGP UW | CoStar Group Inc | 3.21% | 7/22/2025 |
Dow Jones Internet Composite Index
| Ticker | Name | Weight in the Index | Expected Earnings Release |
| NFLX UW | Netflix Inc | 10.14% | 7/17/2025 |
| META UW | Meta Platforms Inc | 10.00% | 7/30/2025 |
| GOOGL UW | Alphabet Inc | 5.29% | 7/23/2025 |
| BKNG UW | Booking Holdings Inc | 4.57% | 7/29/2025 |
| CRM UN | Salesforce Inc | 4.41% | 8/28/2025 |
| GOOG UW | Alphabet Inc | 4.29% | 7/23/2025 |
| ANET UN | Arista Networks Inc | 4.24% | 7/30/2025 |
| DASH UW | DoorDash Inc | 3.37% | 8/6/2025 |
| PYPL UW | PayPal Holdings Inc | 3.00% | 7/29/2025 |
| SNOW UN | Snowflake Inc | 2.99% | 8/21/2025 |
S&P Biotechnology Select Industry Index
| Ticker | Name | Weight in the Index | Expected Earnings Release |
| MRNA UW | Moderna Inc | 2.67% | 8/1/2025 |
| ALNY UW | Alnylam Pharmaceuticals Inc | 2.63% | 8/1/2025 |
| EXEL UW | Exelixis Inc | 2.56% | 8/6/2025 |
| UTHR UW | United Therapeutics Corp | 2.55% | 7/31/2025 |
| REGN UW | Regeneron Pharmaceuticals Inc | 2.52% | 8/1/2025 |
| NBIX UW | Neurocrine Biosciences Inc | 2.51% | 8/1/2025 |
| GILD UW | Gilead Sciences Inc | 2.48% | 8/8/2025 |
| VRTX UW | Vertex Pharmaceuticals Inc | 2.48% | 8/1/2025 |
| AMGN UW | Amgen Inc | 2.45% | 8/5/2025 |
| HALO UW | Halozyme Therapeutics Inc | 2.44% | 8/6/2025 |
NYSE Semiconductor Index
| Ticker | Name | Weight in the Index | Expected Earnings Release |
| NVDA UW | NVIDIA Corp | 8.30% | 8/27/2025 |
| AVGO UW | Broadcom Inc | 8.09% | 9/5/2025 |
| TXN UW | Texas Instruments Inc | 7.06% | 7/22/2025 |
| QCOM UW | QUALCOMM Inc | 6.61% | 7/30/2025 |
| MU UW | Micron Technology Inc | 4.49% | 9/25/2025 |
| MCHP UW | Microchip Technology Inc | 4.43% | 8/1/2025 |
| KLAC UW | KLA Corp | 4.29% | 7/24/2025 |
| MRVL UW | Marvell Technology Inc | 4.28% | 8/29/2025 |
| NXPI UW | NXP Semiconductors NV | 4.25% | 7/21/2025 |
| MPWR UW | Monolithic Power Systems Inc | 4.00% | 8/1/2025 |
Dow Jones U.S. Select Home Construction Index
| Ticker | Name | Weight in the Index | Expected Earnings Release |
| DHI UN | DR Horton Inc | 14.33% | 7/22/2025 |
| LEN UN | Lennar Corp | 10.03% | 9/19/2025 |
| NVR UN | NVR Inc | 8.73% | 7/23/2025 |
| PHM UN | PulteGroup Inc | 8.58% | 7/22/2025 |
| TOL UN | Toll Brothers Inc | 4.59% | 8/20/2025 |
| HD UN | Home Depot Inc/The | 4.49% | 8/19/2025 |
| LOW UN | Lowe's Cos Inc | 4.48% | 8/20/2025 |
| SHW UN | Sherwin-Williams Co/The | 4.29% | 7/22/2025 |
| LII UN | Lennox International Inc | 3.28% | 7/24/2025 |
| TMHC UN | Taylor Morrison Home Corp | 2.49% | 7/23/2025 |
NASDAQ 100 Equal Weighted Index
| Ticker | Name | Weight in the Index | Expected Earnings Release |
| NFLX UW | Netflix Inc | 10.14% | 7/17/2025 |
| META UW | Meta Platforms Inc | 10.00% | 7/30/2025 |
| GOOGL UW | Alphabet Inc | 5.29% | 7/23/2025 |
| BKNG UW | Booking Holdings Inc | 4.57% | 7/29/2025 |
| CRM UN | Salesforce Inc | 4.41% | 8/28/2025 |
| GOOG UW | Alphabet Inc | 4.29% | 7/23/2025 |
| ANET UN | Arista Networks Inc | 4.24% | 7/30/2025 |
| DASH UW | DoorDash Inc | 3.37% | 8/6/2025 |
| PYPL UW | PayPal Holdings Inc | 3.00% | 7/29/2025 |
| SNOW UN | Snowflake Inc | 2.99% | 8/21/2025 |
S&P Mid Cap 400® Index
| Ticker | Name | Weight in the Index | Expected Earnings Release |
| IBKR UW | Interactive Brokers Group Inc | 0.86% | 7/17/2025 |
| EME UN | EMCOR Group Inc | 0.83% | 7/25/2025 |
| FLEX UW | Flex Ltd | 0.67% | 7/24/2025 |
| RBA UN | RB Global Inc | 0.66% | 8/6/2025 |
| GWRE UN | Guidewire Software Inc | 0.65% | 9/5/2025 |
| CASY UW | Casey's General Stores Inc | 0.65% | 9/4/2025 |
| FIX UN | Comfort Systems USA Inc | 0.64% | 7/25/2025 |
| CW UN | Curtiss-Wright Corp | 0.62% | 8/7/2025 |
| USFD UN | US Foods Holding Corp | 0.61% | 8/8/2025 |
| PSTG UN | Pure Storage Inc | 0.59% | 8/28/2025 |
Russell 2000® Index
| Ticker | Name | Weight in the Index | Expected Earnings Release |
| CRDO UW | Credo Technology Group Holding Ltd | 0.52% | 9/4/2025 |
| IONQ UN | IonQ Inc | 0.40% | 8/7/2025 |
| FN UN | Fabrinet | 0.40% | 8/19/2025 |
| NXT UW | NEXTracker Inc | 0.36% | 8/1/2025 |
| HIMS UN | Hims & Hers Health Inc | 0.34% | 8/5/2025 |
| FLR UN | Fluor Corp | 0.34% | 8/1/2025 |
| HQY UW | HealthEquity Inc | 0.33% | 9/3/2025 |
| ENSG UW | Ensign Group Inc/The | 0.32% | 7/25/2025 |
| BPMC UW | Blueprint Medicines Corp | 0.32% | 8/1/2025 |
| UMBF UW | UMB Financial Corp | 0.31% | 7/30/2025 |
Technology Select Sector Index
| Ticker | Name | Weight in the Index | Expected Earnings Release |
| NVDA UW | NVIDIA Corp | 14.61% | 8/27/2025 |
| MSFT UW | Microsoft Corp | 14.00% | 7/30/2025 |
| AVGO UW | Broadcom Inc | 4.92% | 9/5/2025 |
| ORCL UN | Oracle Corp | 3.76% | 9/9/2025 |
| PLTR UW | Palantir Technologies Inc | 2.89% | 8/4/2025 |
| CSCO UW | Cisco Systems Inc | 2.71% | 8/14/2025 |
| IBM UN | International Business Machines Corp | 2.69% | 7/23/2025 |
| CRM UN | Salesforce Inc | 2.57% | 8/28/2025 |
| AMD UW | Advanced Micro Devices Inc | 2.17% | 7/30/2025 |
| INTU UW | Intuit Inc | 2.17% | 8/22/2025 |
Energy Select Sector Index
| Ticker | Name | Weight in the Index | Expected Earnings Release |
| XOM UN | Exxon Mobil Corp | 23.30% | 8/1/2025 |
| CVX UN | Chevron Corp | 14.99% | 8/1/2025 |
| EOG UN | EOG Resources Inc | 4.47% | 8/7/2025 |
| WMB UN | Williams Cos Inc/The | 4.41% | 8/5/2025 |
| KMI UN | Kinder Morgan Inc | 4.04% | 7/17/2025 |
| MPC UN | Marathon Petroleum Corp | 3.99% | 8/5/2025 |
| PSX UN | Phillips 66 | 3.81% | 7/25/2025 |
| OKE UN | ONEOK Inc | 3.69% | 8/4/2025 |
| SLB UN | Schlumberger NV | 3.52% | 7/18/2025 |
| VLO UN | Valero Energy Corp | 3.33% | 7/24/2025 |
Utilities Select Sector Index
| Ticker | Name | Weight in the Index | Expected Earnings Release |
| NEE UN | NextEra Energy Inc | 12.18% | 7/24/2025 |
| SO UN | Southern Co/The | 7.98% | 7/31/2025 |
| CEG UW | Constellation Energy Corp | 7.86% | 8/7/2025 |
| VST UN | Vistra Corp | 5.22% | 8/8/2025 |
| SRE UN | Sempra | 3.86% | 8/6/2025 |
| D UN | Dominion Energy Inc | 3.82% | 8/1/2025 |
| EXC UW | Exelon Corp | 3.46% | 7/31/2025 |
| PEG UN | Public Service Enterprise Group Inc | 3.26% | 7/30/2025 |
| XEL UW | Xcel Energy Inc | 3.11% | 7/31/2025 |
| ETR UN | Entergy Corp | 2.89% | 8/1/2025 |
S&P Transportation Select Industry FMC Capped Index
| Ticker | Name | Weight in the Index | Expected Earnings Release |
| UBER UN | Uber Technologies Inc | 23.68% | 8/6/2025 |
| UNP UN | Union Pacific Corp | 16.58% | 7/24/2025 |
| UPS UN | United Parcel Service Inc | 5.41% | 7/29/2025 |
| NSC UN | Norfolk Southern Corp | 4.41% | 7/29/2025 |
| UAL UW | United Airlines Holdings Inc | 4.40% | 7/16/2025 |
| CSX UW | CSX Corp | 4.37% | 7/23/2025 |
| ODFL UW | Old Dominion Freight Line Inc | 4.37% | 7/30/2025 |
| DAL UN | Delta Air Lines Inc | 4.31% | 7/10/2025 |
| LUV UN | Southwest Airlines Co | 3.21% | 7/24/2025 |
| EXPD UN | Expeditors International of Washington Inc | 2.69% | 8/5/2025 |
S&P Retail Select Industry Index
| Ticker | Name | Weight in the Index | Expected Earnings Release |
| OLLI UQ | Ollie's Bargain Outlet Holdings Inc | 1.53% | 8/29/2025 |
| ANF UN | Abercrombie & Fitch Co | 1.52% | 8/28/2025 |
| SAH UN | Sonic Automotive Inc | 1.52% | 8/5/2025 |
| DKS UN | Dick's Sporting Goods Inc | 1.49% | 9/4/2025 |
| GRPN UW | Groupon Inc | 1.49% | 7/30/2025 |
| DDS UN | Dillard's Inc | 1.49% | 8/15/2025 |
| SBH UN | Sally Beauty Holdings Inc | 1.47% | 8/8/2025 |
| DLTR UW | Dollar Tree Inc | 1.47% | 9/4/2025 |
| TSCO UW | Tractor Supply Co | 1.47% | 7/24/2025 |
| KR UN | Kroger Co/The | 1.46% | 9/12/2025 |
S&P Oil & Gas Exploration & Production Select Industry Index
| Ticker | Name | Weight in the Index | Expected Earnings Release |
| DINO UN | HF Sinclair Corp | 3.35% | 7/31/2025 |
| VLO UN | Valero Energy Corp | 3.13% | 7/24/2025 |
| MPC UN | Marathon Petroleum Corp | 3.12% | 8/5/2025 |
| PSX UN | Phillips 66 | 3.06% | 7/25/2025 |
| EQT UN | EQT Corp | 3.01% | 7/22/2025 |
| XOM UN | Exxon Mobil Corp | 2.97% | 8/1/2025 |
| CVX UN | Chevron Corp | 2.95% | 8/1/2025 |
| HES UN | Hess Corp | 2.95% | 7/31/2025 |
| MTDR UN | Matador Resources Co | 2.95% | 7/22/2025 |
| CNX UN | CNX Resources Corp | 2.93% | 7/24/2025 |
S&P Regional Banks Select Industry Index
| Ticker | Name | Weight in the Index | Expected Earnings Release |
| EWBC UW | East West Bancorp Inc | 2.62% | 7/22/2025 |
| CFG UN | Citizens Financial Group Inc | 2.59% | 7/17/2025 |
| WAL UN | Western Alliance Bancorp | 2.57% | 7/18/2025 |
| ZION UW | Zions Bancorp NA | 2.56% | 7/21/2025 |
| TFC UN | Truist Financial Corp | 2.55% | 7/18/2025 |
| RF UN | Regions Financial Corp | 2.50% | 7/18/2025 |
| FHN UN | First Horizon Corp | 2.49% | 7/16/2025 |
| HBAN UW | Huntington Bancshares Inc/OH | 2.47% | 7/18/2025 |
| MTB UN | M&T Bank Corp | 2.47% | 7/16/2025 |
| WBS UN | Webster Financial Corp | 2.45% | 7/23/2025 |
Dow Jones U.S. Select Aerospace & Defense Index
| Ticker | Name | Weight in the Index | Expected Earnings Release |
| GE UN | General Electric Co | 20.02% | 7/17/2025 |
| RTX UN | RTX Corp | 14.72% | 7/22/2025 |
| BA UN | Boeing Co/The | 9.07% | 7/29/2025 |
| GD UN | General Dynamics Corp | 4.62% | 7/24/2025 |
| TDG UN | TransDigm Group Inc | 4.61% | 8/6/2025 |
| HWM UN | Howmet Aerospace Inc | 4.55% | 7/30/2025 |
| LHX UN | L3Harris Technologies Inc | 4.50% | 7/24/2025 |
| NOC UN | Northrop Grumman Corp | 4.47% | 7/22/2025 |
| AXON UW | Axon Enterprise Inc | 4.44% | 8/6/2025 |
| LMT UN | Lockheed Martin Corp | 4.42% | 7/22/2025 |
NYSE FANG+ Index
| Ticker | Name | Weight in the Index | Expected Earnings Release |
| NVDA UW | NVIDIA Corp | 10.44% | 8/27/2025 |
| NFLX UW | Netflix Inc | 10.01% | 7/17/2025 |
| MSFT UW | Microsoft Corp | 9.89% | 7/30/2025 |
| META UW | Meta Platforms Inc | 9.84% | 7/30/2025 |
| NOW UN | ServiceNow Inc | 9.79% | 7/23/2025 |
| CRWD UW | Crowdstrike Holdings Inc | 9.75% | 8/28/2025 |
| GOOGL UW | Alphabet Inc | 9.56% | 7/23/2025 |
Single Stock Daily Leveraged & Inverse ETFs
- Direxion Daily AAPL Bull 2X (AAPU) and Bear 1X (AAPD) Shares
- Direxion Daily AMD Bull 2X (AMUU) and Bear 1X (AMDD) Shares
- Direxion Daily AMZN Bull 2X (AMZU) and Bear 1X (AMZD) Shares
- Direxion Daily AVGO Bull 2X (AVL) and Bear 1X (AVS) Shares
- Direxion Daily BA Bull 2X (BOEU) and Bear 1X (BOED) Shares
- Direxion Daily BRKB Bull 2X (BRKU) and Bear 1X (BRKD) Shares
- Direxion Daily CSCO Bull 2X (CSCL) and Bear 1X (CSCS) Shares
- Direxion Daily LLY Bull 2X (ELIL) and Bear 1X (ELIS) Shares
- Direxion Daily GOOGL Bull 2X (GGLL) and Bear 1X (GGLS) Shares
- Direxion Daily META Bull 2X (METU) and Bear 1X (METD) Shares
- Direxion Daily MSFT Bull 2X (MSFU) and Bear 1X (MSFD) Shares
- Direxion Daily MU Bull 2X (MUU) and Bear 1X (MUD) Shares
- Direxion Daily NFLX Bull 2X (NFXL) and Bear 1X (NFXS) Shares
- Direxion Daily NVDA Bull 2X (NVDU) and Bear 1X (NVDD) Shares
- Direxion Daily PANW Bull 2X (PALU) and Bear 1X (PALD) Shares
- Direxion Daily PLTR Bull 2X (PLTU) and Bear 1X (PLTD) Shares
- Direxion Daily QCOM Bull 2X (QCMU) and Bear 1X (QCMD) Shares
- Direxion Daily TSLA Bull 2X (TSLL) and Bear 1X (TSLS) Shares
- Direxion Daily TSM Bull 2X (TSMX) and Bear 1X (TSMZ) Shares
- Direxion Daily XOM Bull 2X (XOMX) and Bear 1X (XOMZ) Shares
| Ticker | Name | L/S Pair | Expected Earnings Release |
| MSFT UW | MICROSOFT CORP | MSFU/MSFD | 7/30/2025 |
| TSLA UW | TESLA INC | TSLL/TSLS | 7/23/2025 |
| AAPL UW | APPLE INC | AAPU/AAPD | 7/31/2025 |
| GOOGL UW | ALPHABET INC-CL A | GGLL/GGLS | 7/23/2025 |
| AMZN UW | AMAZON.COM INC | AMZU/AMZD | 7/31/2025 |
| NVDA UW | NVIDIA CORP | NVDU/NVDD | 8/27/2025 |
| META UW | META PLATFORMS INC-CLASS A | METU/METD | 7/30/2025 |
| NFLX UW | NETFLIX INC | NFXL/NFXS | 7/17/2025 |
| TSM UN | TAIWAN SEMICONDUCTOR-SP ADR | TSMX/TSMZ | 7/17/2025 |
| MU UW | MICRON TECHNOLOGY INC | MUU/MUD | 9/25/2025 |
| AVGO UW | BROADCOM INC | AVL/AVS | 9/5/2025 |
| PLTR UW | PALANTIR TECHNOLOGIES INC-A | PLTU/PLTD | 8/4/2025 |
| BRK/B UN | BERKSHIRE HATHAWAY INC-CL B | PLTU/PLTD | 8/4/2025 |
| AMD UW | ADVANCED MICRO DEVICES | AMUU/AMDD | 8/5/2025 |
| PANW UW | PALO ALTO NETWORKS INC | PALU/PALD | 8/19/2025 |
| LLY UN | ELI LILLY & CO | ELIL/ELIS | 8/7/2025 |
| BA UN | BOEING CO/THE | BOEU/BOED | 7/29/2025 |
| XOM UN | EXXON MOBIL CORP | XOMX/XOMZ | 8/1/2025 |
| CSCO UW | CISCO SYSTEMS INC | CSCL/CSCS | 8/14/2025 |
| QCOM UW | QUALCOMM INC | QCMU/QCMD | 7/30/2025 |
*Definitions and Index Descriptions
Index Descriptions
- S&P 500® Index (SPXT) - Standard & Poor’s® selects the stocks comprising the S&P 500® Index (SPXT) on the basis of market capitalization, financial viability of the company and the public float, liquidity and price of a company’s shares outstanding. The Index is a float-adjusted, market capitalization-weighted index.
- S&P 500® High Beta Index (SP5HBIT) - Provided by S&P Dow Jones Indices (the "Index Provider"), which selects 100 securities to include in the Index from the S&P 500® Index that have the highest sensitivity to market movements, or “beta” over the past 12 months as determined by the Index Provider. Securities with the highest beta are generally the most volatile securities of the S&P 500® Index.
- Financial Select Sector Index (IXMTR) - Provided by S&P Dow Jones Indices and includes securities of companies from the following industries: Banks; Thrifts & Mortgage Finance; Diversified Financial Services; Consumer Finance; Capital Markets; Insurance; and Mortgage Real Estate Investment Trusts (REITs).
- Health Care Select Sector Index (IXVTR) - Provided by Standard & Poor’s and includes domestic companies from the healthcare sector, which includes the following industries: pharmaceuticals; health care equipment and supplies; health care providers and services; biotechnology; life sciences tools and services; and health care technology.
- Industrials Select Sector Index (IXITR) - Provided by S&P Dow Jones Indices and includes domestic companies from the industrials sector which includes the following industries: aerospace and defense; industrial conglomerates; marine; transportation infrastructure; machinery; road and rail; air freight and logistics; commercial services and supplies; professional services; electrical equipment; construction and engineering; trading companies and distributors; airlines; and building products.
- Indxx Magnificent 7 Index (IFOTQ) - Provided by Indxx and is designed to track the performance of the seven largest NASDAQ listed companies.
- Real Estate Select Sector Index (IXRETR) - Provided by S&P Dow Jones Indices (the “Index Provider”) and includes securities of companies from the following industries: real estate management and development and real estate investment trusts (“REITs”), excluding mortgage REITs.
- Dow Jones Internet Composite Index (DJINETT) - Provided by S&P Dow Jones Indices and includes companies that generate at least 50% of their annual sales/revenue from the internet as determined by the Index Provider. Additionally, each stock must have a minimum of three months’ trading history and a three month average market capitalization of at least $100 million. The Index consists of 40 stocks from two different sectors, internet commerce and internet services
- S&P Biotechnology Select Industry Index (SPSIBITR) - Provided by S&P Dow Jones Indices LLC and includes domestic companies from the biotechnology industry. The Index is a modified equal – weighted index that is designed to measure the performance of the biotechnology sub-industry based on the Global Industry Classification Standards (GICS).
- NYSE Semiconductor Index (ICESEMIT) - A rules-based, modified float-adjusted market capitalization-weighted index that tracks the performance of the thirty largest U.S. listed semiconductor companies.
- Dow Jones U.S. Select Home Construction Index (DJSHMBT) - Measures U.S companies in the home construction sector that provide a wide range of products and services related to homebuilding, including home construction and producers, sellers and suppliers of building materials, furnishings and fixtures and also home improvement retailers. The Index may include large-, mid- or small-capitalization companies.
- NASDAQ 100® Equal Weighted Index (NETR) - Includes 100 of the largest non-financial securities listed on NASDAQ®, but instead of being weighted by market capitalization, each of the constituents is initially set at 1.00%.
- S&P Mid Cap 400® Index (SPTRMDCP) - Measures the performance of 400 mid-sized companies in the United States. The Index is a free-float adjusted market capitalization-weighted index composed of liquid common stocks.
- Russell 2000® Index (RU20INTR) - Measures the performance of approximately 2,000 small-capitalization companies in the Russell 3000® Index, based on a combination of their market capitalization.
- Technology Select Sector Index (IXTTR) - Provided by S&P Dow Jones Indices and includes domestic companies from the technology sector which includes the following industries: computers and peripherals; software; diversified telecommunications services; communications equipment; semiconductors and semi-conductor equipment; internet software and services; IT services; electronic equipment, instruments and components; wireless telecommunication services; and office electronics.
- Energy Select Sector Index (IXETR) - Provided by S&P Dow Jones Indices and includes domestic companies from the energy sector which includes the following industries: oil, gas and consumable fuels; and energy equipment and services.
- Utilities Select Sector Index (IXUTR) - Provided by S&P Dow Jones Indices and includes domestic companies from the utilities sector which includes the following industries: electric utilities; multi-utilities; water utilities; independent power producers and energy trades; and gas utilities.
- S&P Transportation Select Industry FMC Capped Index (SPTSCUT) - Provided by S&P Dow Jones Indices and is designed to measure stocks in the S&P Total Market Index that are included in the GICS transportation sub-industry.
- S&P Retail Select Industry Index (SPSIRETR) - A modified equal-weighted index that is designed to measure performance of the stocks comprising the S&P Total Market Index that are classified in the Global Industry Classification Standard (GICS) retail sub-industry.
- S&P Oil & Gas Exploration & Production Select Industry Index (SPSIOPTR) - Provided by Standard & Poor’s Index Provider and includes domestic companies from the oil and gas exploration and production sub industry. The Index is a modified equal weighted index that is designed to measure the performance of a sub industry or group of sub industries determined based on the Global Industry Classification Standards (GICS).
- S&P Regional Banks Select Industry Index (SPSIRBKT) - A modified equal-weighted index that is designed to measure performance of the stocks comprising the S&P Total Market Index that are classified in the Global Industry Classification Standard (GICS) regional banks sub-industry.
- Dow Jones U.S. Select Aerospace & Defense Index (DJSASDT) - Provided by Dow Jones U.S. Index (the “Index Provider”). The Index attempts to measure the performance of the aerospace and defense industry of the U.S. equity market. The Index Provider selects the stocks comprising the Index from the aerospace and defense sector on the basis of the float-adjusted, market capitalization-weight of each constituent. Aerospace companies include manufacturers, assemblers and distributors of aircraft and aircraft parts. Defense companies include producers of components and equipment for the defense industry, such as military aircraft, radar equipment and weapons.
- NYSE FANG+ Index (NYFANGT) - An equal-dollar weighted Index designed to track the performance of 10 highly-traded growth stocks of technology and tech-enabled companies. The Index is comprised of the securities of U.S.-listed companies that ICE Data Indices, LLC (the “Index Provider”) has identified as FANG+ companies, which are comprised of the six FAANMG companies and four non-FAANMG companies. The Index Provider defines the FAANMG as Meta Platforms Inc. (META), Apple Inc. (AAPL), Amazon.com Inc. (AMZN), Netflix Inc. (NFLX), Microsoft Corp. (MSFT), and Alphabet Inc. Class A (GOOGL). The Index is reconstituted quarterly.
An investor should carefully consider a Fund’s investment objective, risks, charges, and expenses before investing. A Fund’s prospectus and summary prospectus contain this and other information about the Direxion Shares. To obtain a Fund’s prospectus and summary prospectus call 866-476-7523 or visit our website at direxion.com. A Fund’s prospectus and summary prospectus should be read carefully before investing.
Direxion Shares ETF Risks – An investment in the ETFs involves risk, including the possible loss of principal. The ETFs are non-diversified and include risks associated with concentration that results from an ETF’s investments in a particular industry, sector or company, which can increase volatility. The use of derivatives such as futures contracts and swaps are subject to market risks that may cause their price to fluctuate over time. The ETFs do not attempt to, and should not be expected to, provide returns which are a multiple of respective underlying security for periods other than a single day. For other risks including leverage, correlation, daily compounding, market volatility and risks specific to an industry, sector or company, please read the prospectus.