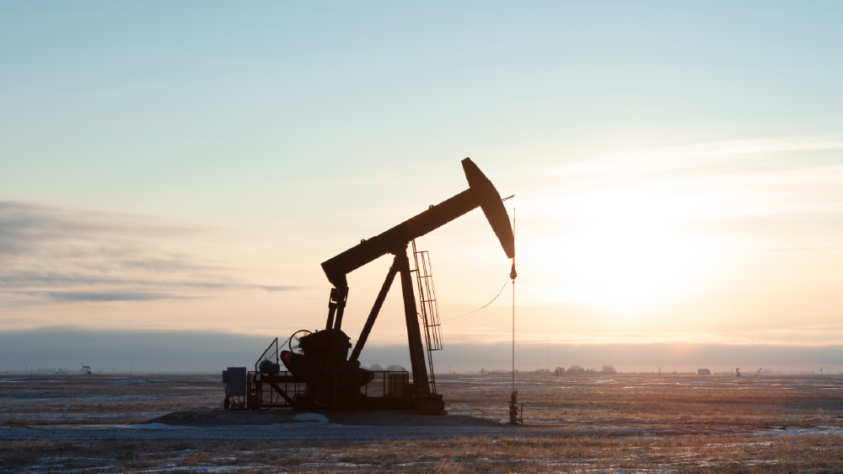
Where’s the Trade in Oil & Gas Exploration Stocks?
Editor’s note: Any and all references to time frames longer than one trading day are for purposes of market context only, and not recommendations of any holding time frame. Daily rebalancing ETFs are not meant to be held unmonitored for long periods. If you don't have the resources, time or inclination to constantly monitor and manage your positions, leveraged and inverse ETFs are not for you.
The global upstream oil and gas industry generated an estimated $1.4 trillion in combined free cash flow over the course of 2022, as prices soared in the first half of the year to a peak of $139 per barrel for Brent crude oil, an international benchmark. While that means upstream companies started 2023 flush with cash, demand uncertainty, continued price volatility, and a changing regulatory environment call for a cautious approach to exploration and production activities. So what should traders watch for in an industry with lots of cash but an uncertain future?
Seasonal Demand, Recessionary Pressures, and China. Oh My.
With Brent bouncing around between $80 and $85, the crude oil benchmark has struggled to break out of a tight trading range with support at $77.50 and resistance at the $89 level. Similarly, West Texas Intermediate (WTI) Crude oil appears range bound between about $72 and $82 but tends to hover at $76. Both are extremely responsive to supply and demand news, though, so range-bound trading is possible despite relatively tight boundaries.
With demand still low, the world’s current oil supply is projected to exceed demand at least until June when seasonal demand usually increases. But come summer, that balance could tip into a deficit as demand grows throughout peak travel season and the meager rate of supply growth anticipated in 2023 is unable to keep up. If that happens, producers could see a spike in the price of oil.
However, recessionary fears have some bearish analysts predicting flat demand throughout the year. In that scenario, supply would remain at or above demand, keeping prices stagnant or pushing them lower.
Moves that could push it toward a bullish breakout − and a boon for oil & gas stocks − include China hitting (or surpassing) its demand targets this travel season or Organization of the Petroleum Exporting Countries (OPEC+) announcing further output cuts to prevent supply outpacing demand. That latter scenario would only become likely if Brent dips back to $75, though, so it would serve more to block a bearish breakout than drive oil prices above $89.
Domestic Oil Production Growth to Slow, Despite Pressure to Ramp up Extraction
President Biden called on oil companies to invest in domestic production during his State of the Union address in February. When gas prices peaked in March last year, he called out producers for not ramping up onshore drilling despite having thousands of approved permits.
According to the Bureau of Land Management, the oil industry is currently sitting on over 6,600 unused permits to drill on federal lands. But approved drilling permits don’t necessarily translate to viable drilling sites. Producers still need to invest in exploration to determine if drilling is even possible, then create a drilling plan that includes capital for drilling rigs and labor to produce oil from that land.
With the cost of extraction as high as $70 per barrel in the United States and the average price of crude oil expected to hover in the $80s for the year, the margins are simply too narrow for many producers to risk drilling. For a bullish breakout in oil & gas, and the companies that produce them, trading would likely have to tip above $89for Brent and $82 for WTI and even at those levels, margins would still be thin for producers, so bearish pressure is likely to remain strong.
Producers and Refiners Weigh Clean Energy Investment Strategies to Adapt to Price Uncertainty
Demand for gasoline fell sharply in the second half of 2022 to the lowest level—excluding 2020—in the past decade. With concerns that a recession is looming, refiners are bracing for the possibility that demand could remain low while global refining capacity increases, putting downward pressure on prices.
While oil prices have ping-ponged over the last three months, gasoline futures have steadily climbed as traders anticipate a seasonal price increase of $0.35-$0.85 per gallon at the pump between March and September. If the long-term downward trend in gasoline demand continues, though, that seasonal uptick would likely stick closer to the $0.35 mark.
On the futures market, Fitch Solutions revised its forecast for the wholesale price of gasoline from $2.90 to $2.70 per gallon in February, citing the risk of recession and softening demand. While demand has already begun its usual seasonal strengthening trend, it’s still lower compared to this same time period last year.
To compensate for declining gasoline demand, many U.S. refiners are prioritizing other petroleum and chemical products or adapting their infrastructure to tap the growing demand for clean energy and renewables. As many as 40% of refiners say their focus will shift toward low-emission fuels like renewable biofuels and biodiesel, where demand is growing rapidly.
That move toward biofuels could pay off soon. In March, the U.S. Environmental Protection Agency proposed expanding sales of the higher ethanol blend E15 fuel year round in time for peak travel season this summer. Currently, sales of the ethanol-gasoline blend is banned between June and September. If the Biden administration signs off on the plan, the expanded availability of E15 could lift biofuel prices, especially ethanol, while dragging gasoline prices this summer. And that may boost oil & gas stocks.
Learn About the Direxion Oil and Gas Leveraged ETFs
With the oil and gas market likely to remain tight throughout the year, every potential catalyst could have an outsized impact on stock prices, especially for upstream companies whose stocks are more sensitive to fluctuations in crude oil prices.
For traders chasing maximum yield, it might be worth trying Direxion’s Daily S&P Oil & Gas Exp. & Prod. Bull (GUSH) and Bear (DRIP) 2X Shares. The leveraged ETFs seek 200% or 200% of the inverse (or opposite), respectively, before fees and expenses, of the S&P Oil & Gas Exploration & Production Select Industry Index.
The S&P Oil & Gas Exploration & Production Select Industry Index is provided by S&P Dow Jones Indices, LLC and includes domestic companies from the oil and gas exploration and production sub-industry. The Index is a modified equal-weighted index that is designed to measure the performance of a sub-industry or group of sub-industries determined based on the Global Industry Classification Standards (GICS). One cannot directly invest in an index.
The top 10 holdings in the index as of 12/31/2022 are:
| PBF Energy | 2.57% |
| APA Corporation | 2.29% |
| Valero Energy | 2.27% |
| Hess | 2.25% |
| Permian | 2.24% |
| Marathon Petroleum | 2.24% |
| Ovintiv | 2.23% |
| Callon Petroleum | 2.23% |
| ConocoPhillips | 2.20% |
| Chevron Texaco | 2.19% |
Holdings subject to change.
With 2X leverage, the results of every trade are magnified which gives traders a way to increase exposure on both bullish and bearish trades. Since losses would also be magnified, it’s still important to manage risk when using these leveraged ETFs. But when used carefully, these can be tools for traders looking to trade their bullish or bearish assumptions about the upstream oil and gas industry.
An investor should carefully consider a Fund’s investment objective, risks, charges, and expenses before investing. A Fund’s prospectus and summary prospectus contain this and other information about the Direxion Shares. To obtain a Fund’s prospectus and summary prospectus call 866-476-7523 or visit our website at www.direxion.com. A Fund’s prospectus and summary prospectus should be read carefully before investing.
The “S&P Oil & Gas Exploration & Production Select Industry Index” is a product of S&P Dow Jones Indices LLC (“SPDJI”), and has been licensed for use by Rafferty Asset Management, LLC (“Rafferty”). Standard & Poor’s® and S&P® are registered trademarks of Standard & Poor’s Financial Services LLC (“S&P”); Dow Jones® is a registered trademark of Dow Jones Trademark Holdings LLC (“Dow Jones”); and these trademarks have been licensed for use by SPDJI and sublicensed for certain purposes by Rafferty. Rafferty’s ETFs are not sponsored, endorsed, sold or promoted by SPDJI, Dow Jones, S&P, their respective affiliates and none of such parties make any representation regarding the advisability of investing in such product(s) nor do they have any liability for any errors, omissions, or interruptions of the S&P Oil & Gas Exploration & Production Select Industry Index.
Leveraged and Inverse ETFs pursue daily leveraged investment objectives which means they are riskier than alternatives which do not use leverage. They seek daily goals and should not be expected to track the underlying index over periods longer than one day. They are not suitable for all investors and should be utilized only by sophisticated investors who understand leverage risk and who actively manage their investments.
Direxion Shares Risks – An investment in each Fund involves risk, including the possible loss of principal. Each Fund is non-diversified and includes risks associated with the Funds’ concentrating their investments in a particular industry, sector, or geography which can increase volatility. The use of derivatives such as futures contracts and swaps are subject to market risks that may cause their price to fluctuate over time. Risks of each Fund include Effects of Compounding and Market Volatility Risk, Leverage Risk, Market Risk, Counterparty Risk, Rebalancing Risk, Intra-Day Investment Risk, Other Investment Companies (including ETFs) Risk, Cash Transaction Risk, Tax Risk, and risks specific to investment in the securities of the Oil and Gas Industry Risk and the Energy Sector. Companies in the oil and gas industry develop and produce crude oil and natural gas and provide drilling and other energy resources production and distribution related services. Stock prices for these types of companies are affected by supply and demand both for their specific product or services and for energy products in general. Additional risks include, for the Direxion Daily S&P Oil & Gas Exp. & Prod. Bull 2X Shares, Daily Index Correlation Risk, and for the Direxion Daily S&P Oil & Gas Exp. & Prod. Bear 2X Shares, Daily Inverse Index Correlation Risk, and risks related to Shorting. Please see the summary and full prospectuses for a more complete description of these and other risks of each Fund.
Distributor: Foreside Fund Services, LLC.