Q3 Earnings: Beat, Miss, or Mayhem. All Fuel for the Bold

Editor's note: Any and all references to time frames longer than one trading day are for purposes of market context only, and not recommendations of any holding time frame. Daily rebalancing ETFs are not meant to be held unmonitored for long periods. If you don't have the resources, time or inclination to constantly monitor and manage your positions, leveraged and inverse ETFs are not for you.
Investing in the funds involves a high degree of risk. Unlike traditional ETFs, or even other leveraged and/or inverse ETFs, these leveraged and/or inverse single-stock ETFs track the price of a single stock rather than an index, eliminating the benefits of diversification. Leveraged and inverse ETFs pursue daily leveraged investment objectives, which means they are riskier than alternatives which do not use leverage. They seek daily goals and should not be expected to track the underlying stock’s performance over periods longer than one day. They are not suitable for all investors and should be utilized only by investors who understand leverage risk and who actively manage their investments. The Funds will lose money if the underlying stock’s performance is flat, and it is possible that the Bull Fund will lose money even if the underlying stock’s performance increases, and the Bear Fund will lose money even if the underlying stock’s performance decreases, over a period longer than a single day. An investor could lose the full principal value of his or her investment in a single day. Investing in the Funds is not equivalent to investing directly in each underlying security.
Q3 Earnings: Beat, Miss, or Mayhem—It’s All Fuel for the Bold
Earnings season is upon us. With Q3 2025 earnings season now underway and early results already hitting the tape, this is the ring where the real fireworks happen for leverage-hungry traders.
Big banks kicked things off with mixed results—stronger credit spreads but weaker loan growth—while early industrials like Delta and PepsiCo showed consumers are still spending, albeit selectively.
With macro drivers like rate expectations, AI hype, and geopolitical overhangs already keeping sentiment on edge, this season is shaping up to be one of the most closely watched in years.
Volatility isn’t just expected—it’s the opportunity. For traders using Direxion’s Leveraged and Inverse ETFs, each earnings surprise, miss, or revision is a potential intraday setup.
What’s Shaping Q3’s Narrative
Earnings calendar intensity & concentration: Tech, semiconductors, energy, and financials remain front and center. The heavyweights are lining up: Tesla reports Oct. 22, Microsoft on Oct. 29, Apple on Oct. 30, and NVIDIA mid-November. Together, these names could dictate the tone for the entire market.
Sentiment, flows & leverage expansion: Flows into Leveraged & Inverse ETFs continue to climb, with traders piling into both bull and bear setups, especially around sin names like TSLA, NVDA, and AAPL. The message is clear: traders aren’t backing off volatility, they’re embracing it.
Macro and policy crosswinds: The Fed’s next moves, debt ceiling noise, global growth divergence, and inflation surprises all have the power to flip the tape mid-season. Recent comments from the Fed about a potential “policy pivot in 2026” have only added to uncertainty, fueling rate-driven swings that often overshadow individual company beats.
Complexities of path dependency: Huge first-day gaps, intraday reversals, guidance shocks — all of these can dramatically amplify or dampen performance over the multi-week span of earnings season. This is the trader’s battlefield—momentum surges that last hours, not weeks.]
What to watch
- Stocks with split-view forecasts or high dispersion in analyst estimates
- Sectors facing margin pressures (semis, autos, energy)
- Guidance tone — the “look-forward” commentary often matters more than the quarter itself
- Volume & volatility gaps — intraday liquidity can make or break leveraged trades
- Macro cross-signals — sometimes macro “news bombs” drown out stock-specific narratives
Here’s a list of announcement dates with related Leveraged & Inverse ETFs, including Single Stock Daily LETFs, week-by-week for 2025’s Q3 earnings season.
Earnings dates are subject to change without notice.
Q3 2025 Earnings Season - % of Each Index Reporting by Week
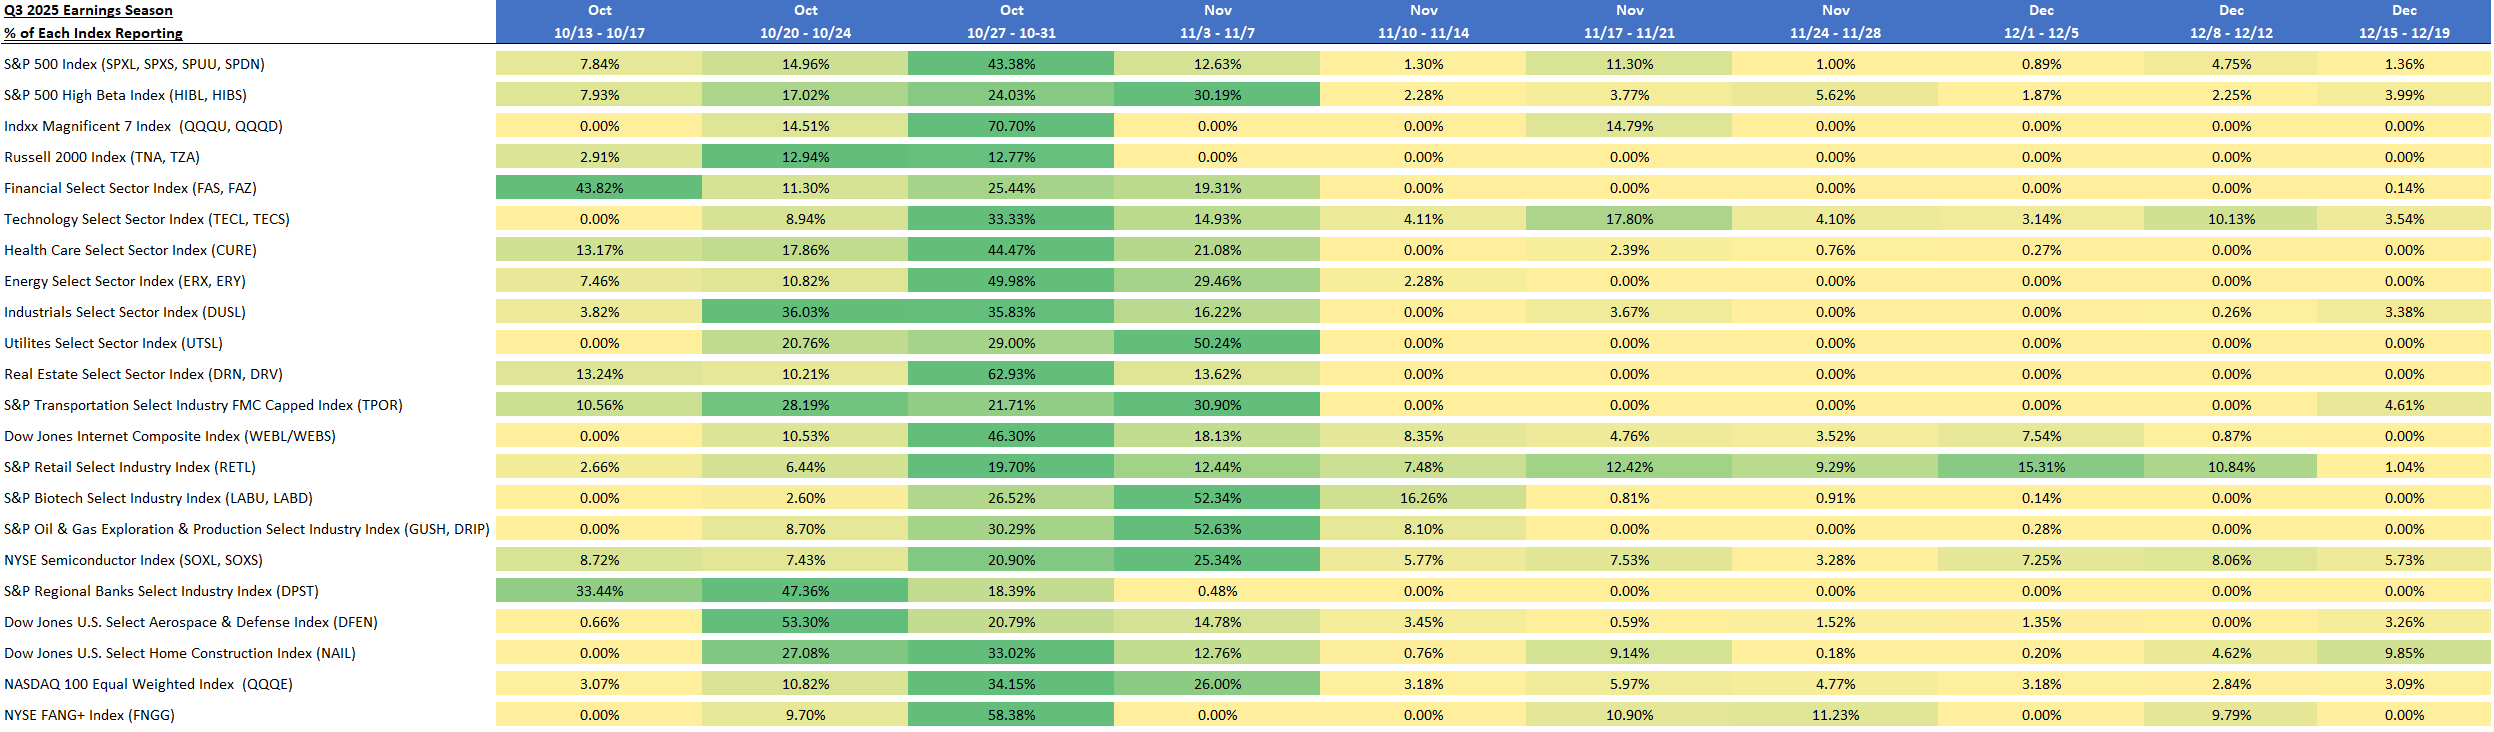
Source: Bloomberg Data Management Services. Figures represent percent of companies in each index expected to release earnings reports by week. Green shading identifies the week with the highest percentages. Index descriptions are provided at the end of the page.
Let Volatility Be Your Superpower
Q3 2025 earnings season is shaping up to be a feast (or a battle) for risk-on traders. With several highly traded names slated to report, and macro uncertainty turning every earnings day into an event, the Direxion’s Leveraged & Inverse ETFs are poised to show their worth—or their danger. If your strategy is nimble, risk-aware, and tuned to both fundamentals and tactical execution, the next few weeks could be your moment.
Significant risk involved.
S&P 500 Index
| Ticker | Name | Weight in Index | Expected Earnings Release |
| NVDA UW | NVIDIA Corp | 8.01% | 11/19/2025 |
| MSFT UW | Microsoft Corp | 6.77% | 10/30/2025 |
| AAPL UW | Apple Inc | 6.65% | 10/30/2025 |
| AMZN UW | Amazon.com Inc | 3.79% | 10/31/2025 |
| AVGO UW | Broadcom Inc | 2.82% | 12/12/2025 |
| META UW | Meta Platforms Inc | 2.70% | 10/29/2025 |
| GOOGL UW | Alphabet Inc | 2.47% | 10/29/2025 |
| TSLA UW | Tesla Inc | 2.14% | 10/22/2025 |
| GOOG UW | Alphabet Inc | 1.99% | 10/29/2025 |
| BRK/B UN | Berkshire Hathaway Inc | 1.59% | 11/3/2025 |
S&P 500 High Beta Index
| Ticker | Name | Weight in Index | Expected Earnings Release |
| MU UW | Micron Technology Inc | 2.23% | 12/18/2025 |
| TSLA UW | Tesla Inc | 1.90% | 10/22/2025 |
| INTC UW | Intel Corp | 1.89% | 10/31/2025 |
| COIN UW | Coinbase Global Inc | 1.76% | 10/30/2025 |
| MPWR UW | Monolithic Power Systems Inc | 1.70% | 10/30/2025 |
| AMD UW | Advanced Micro Devices Inc | 1.62% | 11/4/2025 |
| LRCX UW | Lam Research Corp | 1.62% | 10/23/2025 |
| WDC UW | Western Digital Corp | 1.58% | 10/24/2025 |
| SMCI UW | Super Micro Computer Inc | 1.48% | 11/5/2025 |
| TER UW | Teradyne Inc | 1.47% | 10/23/2025 |
Financials Select Sector Index
| Ticker | Name | Weight in Index | Expected Earnings Release |
| BRK/B UN | Berkshire Hathaway Inc | 11.96% | 11/3/2025 |
| JPM UN | JPMorgan Chase & Co | 10.91% | 10/14/2025 |
| V UN | Visa Inc | 7.79% | 10/28/2025 |
| MA UN | Mastercard Inc | 6.21% | 10/31/2025 |
| BAC UN | Bank of America Corp | 4.43% | 10/15/2025 |
| WFC UN | Wells Fargo & Co | 3.33% | 10/14/2025 |
| GS UN | Goldman Sachs Group Inc/The | 3.07% | 10/14/2025 |
| MS UN | Morgan Stanley | 2.46% | 10/15/2025 |
| C UN | Citigroup Inc | 2.32% | 10/14/2025 |
| AXP UN | American Express Co | 2.29% | 10/17/2025 |
Health Care Select Sector Index
| Ticker | Name | Weight in Index | Expected Earnings Release |
| LLY UN | Eli Lilly & Co | 12.82% | 10/30/2025 |
| JNJ UN | Johnson & Johnson | 8.71% | 10/14/2025 |
| ABBV UN | AbbVie Inc | 7.79% | 10/31/2025 |
| UNH UN | UnitedHealth Group Inc | 6.39% | 10/28/2025 |
| ABT UN | Abbott Laboratories | 4.46% | 10/15/2025 |
| MRK UN | Merck & Co Inc | 4.12% | 10/30/2025 |
| TMO UN | Thermo Fisher Scientific Inc | 3.86% | 10/22/2025 |
| ISRG UW | Intuitive Surgical Inc | 3.06% | 10/21/2025 |
| AMGN UW | Amgen Inc | 3.02% | 11/4/2025 |
| GILD UW | Gilead Sciences Inc | 2.80% | 11/6/2025 |
Industrials Select Sector Index
| Ticker | Name | Weight in Index | Expected Earnings Release |
| GE UN | General Electric Co | 6.73% | 10/21/2025 |
| CAT UN | Caterpillar Inc | 4.94% | 10/29/2025 |
| RTX UN | RTX Corp | 4.73% | 10/21/2025 |
| UBER UN | Uber Technologies Inc | 4.34% | 11/4/2025 |
| BA UN | Boeing Co/The | 3.57% | 10/29/2025 |
| GEV UN | GE Vernova Inc | 3.57% | 10/23/2025 |
| ETN UN | Eaton Corp PLC | 3.08% | 10/31/2025 |
| UNP UN | Union Pacific Corp | 2.89% | 10/23/2025 |
| HON UW | Honeywell International Inc | 2.80% | 10/23/2025 |
| ADP UW | Automatic Data Processing Inc | 2.47% | 10/29/2025 |
Real Estate Select Sector Index
| Ticker | Name | Weight in Index | Expected Earnings Release |
| WELL UN | Welltower Inc | 9.34% | 10/27/2025 |
| PLD UN | Prologis Inc | 8.89% | 10/15/2025 |
| AMT UN | American Tower Corp | 7.18% | 10/28/2025 |
| EQIX UW | Equinix Inc | 6.50% | 10/29/2025 |
| SPG UN | Simon Property Group Inc | 4.81% | 11/3/2025 |
| PSA UN | Public Storage | 4.62% | 10/29/2025 |
| DLR UN | Digital Realty Trust Inc | 4.61% | 10/24/2025 |
| O UN | Realty Income Corp | 4.52% | 11/3/2025 |
| CCI UN | Crown Castle Inc | 4.34% | 10/16/2025 |
| CBRE UN | CBRE Group Inc | 4.25% | 10/23/2025 |
Dow Jones Internet Composite Index
| Ticker | Name | Weight in Index | Expected Earnings Release |
| AMZN UW | Amazon.com Inc | 9.77% | 10/31/2025 |
| NFLX UW | Netflix Inc | 9.67% | 10/21/2025 |
| META UW | Meta Platforms Inc | 9.54% | 10/29/2025 |
| GOOGL UW | Alphabet Inc | 5.66% | 10/29/2025 |
| CSCO UW | Cisco Systems Inc | 5.22% | 11/13/2025 |
| ANET UN | Arista Networks Inc | 4.69% | 11/4/2025 |
| GOOG UW | Alphabet Inc | 4.56% | 10/29/2025 |
| CRM UN | Salesforce Inc | 4.46% | 12/3/2025 |
| BKNG UW | Booking Holdings Inc | 4.21% | 10/28/2025 |
| DASH UW | DoorDash Inc | 4.01% | 11/5/2025 |
S&P Biotechnology Select Industry Index
| Ticker | Name | Weight in Index | Expected Earnings Release |
| CRSP UQ | CRISPR Therapeutics AG | 2.55% | 11/5/2025 |
| MRNA UW | Moderna Inc | 1.99% | 11/7/2025 |
| UTHR UW | United Therapeutics Corp | 1.96% | 10/30/2025 |
| INSM UW | Insmed Inc | 1.92% | 10/31/2025 |
| IONS UW | Ionis Pharmaceuticals Inc | 1.89% | 11/6/2025 |
| ABBV UN | AbbVie Inc | 1.89% | 10/31/2025 |
| VRTX UW | Vertex Pharmaceuticals Inc | 1.87% | 11/3/2025 |
| EXAS UR | Exact Sciences Corp | 1.87% | 11/3/2025 |
| RVMD UW | Revolution Medicines Inc | 1.85% | 11/6/2025 |
| BIIB UW | Biogen Inc | 1.83% | 10/30/2025 |
NYSE Semiconductor Index
| Ticker | Name | Weight in Index | Expected Earnings Release |
| AMD UW | Advanced Micro Devices Inc | 10.04% | 11/4/2025 |
| AVGO UW | Broadcom Inc | 8.06% | 12/12/2025 |
| NVDA UW | NVIDIA Corp | 7.53% | 11/19/2025 |
| MU UW | Micron Technology Inc | 5.73% | 12/18/2025 |
| QCOM UW | QUALCOMM Inc | 5.40% | 11/6/2025 |
| INTC UW | Intel Corp | 5.11% | 10/31/2025 |
| MRVL UW | Marvell Technology Inc | 5.10% | 12/3/2025 |
| AMAT UW | Applied Materials Inc | 4.69% | 11/14/2025 |
| TXN UW | Texas Instruments Inc | 4.64% | 10/21/2025 |
| ASML UW | ASML Holding NV | 4.38% | 10/15/2025 |
Dow Jones U.S. Select Home Construction Index
| Ticker | Name | Weight in Index | Expected Earnings Release |
| DHI UN | DR Horton Inc | 15.27% | 10/28/2025 |
| LEN UN | Lennar Corp | 9.49% | 12/18/2025 |
| PHM UN | PulteGroup Inc | 8.74% | 10/21/2025 |
| NVR UN | NVR Inc | 7.73% | 10/22/2025 |
| SHW UN | Sherwin-Williams Co/The | 4.62% | 10/28/2025 |
| HD UN | Home Depot Inc/The | 4.54% | 11/18/2025 |
| TOL UN | Toll Brothers Inc | 4.50% | 12/9/2025 |
| LOW UN | Lowe's Cos Inc | 4.36% | 11/19/2025 |
| BLD UN | TopBuild Corp | 4.24% | 11/4/2025 |
| LII UN | Lennox International Inc | 3.23% | 10/22/2025 |
NASDAQ 100 Equal Weighted Index
| Ticker | Name | Weight in Index | Expected Earnings Release |
| AMD UW | Advanced Micro Devices Inc | 1.46% | 11/4/2025 |
| INTC UW | Intel Corp | 1.23% | 10/31/2025 |
| MRVL UW | Marvell Technology Inc | 1.21% | 12/3/2025 |
| TTD UQ | Trade Desk Inc/The | 1.18% | 11/7/2025 |
| MU UW | Micron Technology Inc | 1.18% | 12/18/2025 |
| DDOG UW | Datadog Inc | 1.15% | 11/7/2025 |
| ARM UW | ARM Holdings PLC | 1.14% | 11/5/2025 |
| EA UW | Electronic Arts Inc | 1.13% | 10/28/2025 |
| AMAT UW | Applied Materials Inc | 1.11% | 11/14/2025 |
| XEL UW | Xcel Energy Inc | 1.11% | 10/30/2025 |
Solactive US AI & Big Data Index
| Ticker | Name | Weight in Index | Expected Earnings Release |
| AAPL UW | Apple Inc | 7.94% | 10/30/2025 |
| AVGO UW | Broadcom Inc | 7.79% | 12/12/2025 |
| NVDA UW | NVIDIA Corp | 7.06% | 11/19/2025 |
| MSFT UW | Microsoft Corp | 6.62% | 10/30/2025 |
| META UW | Meta Platforms Inc | 6.61% | 10/29/2025 |
| AMZN UW | Amazon.com Inc | 6.50% | 10/31/2025 |
| INTC UW | Intel Corp | 6.36% | 10/31/2025 |
| AMD UW | Advanced Micro Devices Inc | 5.69% | 11/4/2025 |
| ANET UN | Arista Networks Inc | 5.45% | 11/4/2025 |
| GOOGL UW | Alphabet Inc | 5.16% | 10/29/2025 |
The Indxx Magnificent 7 Index
| Ticker | Name | Weight in Index | Expected Earnings Release |
| NVDA UW | NVIDIA Corp | 14.79% | 11/19/2025 |
| MSFT UW | Microsoft Corp | 14.65% | 10/30/2025 |
| TSLA UW | Tesla Inc | 14.51% | 10/22/2025 |
| AAPL UW | Apple Inc | 14.47% | 10/30/2025 |
| AMZN UW | Amazon.com Inc | 14.21% | 10/31/2025 |
| GOOGL UW | Alphabet Inc | 13.91% | 10/29/2025 |
| META UW | Meta Platforms Inc | 13.47% | 10/29/2025 |
Russell 2000® Index
| Ticker | Name | Weight in Index | Expected Earnings Release |
| CRDO UW | Credo Technology Group Holding | 0.76% | 12/2/2025 |
| IONQ UN | IonQ Inc | 0.71% | 11/6/2025 |
| BE UN | Bloom Energy Corp | 0.65% | 11/7/2025 |
| KTOS UW | Kratos Defense & Security Solu | 0.61% | 11/7/2025 |
| OKLO UN | Oklo Inc | 0.51% | 11/14/2025 |
| FN UN | Fabrinet | 0.48% | 11/4/2025 |
| RGTI UR | Rigetti Computing Inc | 0.48% | 11/12/2025 |
| CDE UN | Coeur Mining Inc | 0.47% | 10/29/2025 |
| AVAV UW | AeroVironment Inc | 0.45% | 12/4/2025 |
| NXT UW | NEXTracker Inc | 0.40% | 10/23/2025 |
Technology Select Sector Index
| Ticker | Name | Weight in Index | Expected Earnings Release |
| NVDA UW | NVIDIA Corp | 14.63% | 11/19/2025 |
| MSFT UW | Microsoft Corp | 12.37% | 10/30/2025 |
| AAPL UW | Apple Inc | 12.14% | 10/30/2025 |
| AVGO UW | Broadcom Inc | 5.15% | 12/12/2025 |
| PLTR UW | Palantir Technologies Inc | 3.69% | 11/4/2025 |
| ORCL UN | Oracle Corp | 3.66% | 12/9/2025 |
| AMD UW | Advanced Micro Devices Inc | 3.38% | 11/4/2025 |
| CSCO UW | Cisco Systems Inc | 2.46% | 11/13/2025 |
| IBM UN | International Business Machine | 2.39% | 10/22/2025 |
| CRM UN | Salesforce Inc | 2.03% | 12/3/2025 |
Energy Select Sector Index
| Ticker | Name | Weight in Index | Expected Earnings Release |
| XOM UN | Exxon Mobil Corp | 23.17% | 10/31/2025 |
| CVX UN | Chevron Corp | 18.02% | 10/31/2025 |
| COP UN | ConocoPhillips | 7.13% | 11/6/2025 |
| WMB UN | Williams Cos Inc/The | 4.83% | 11/6/2025 |
| EOG UN | EOG Resources Inc | 4.11% | 11/6/2025 |
| MPC UN | Marathon Petroleum Corp | 4.05% | 11/4/2025 |
| KMI UN | Kinder Morgan Inc | 3.88% | 10/16/2025 |
| PSX UN | Phillips 66 | 3.75% | 10/29/2025 |
| SLB UN | SLB Ltd | 3.58% | 10/17/2025 |
| VLO UN | Valero Energy Corp | 3.56% | 10/23/2025 |
Utilities Select Sector Index
| Ticker | Name | Weight in Index | Expected Earnings Release |
| NEE UN | NextEra Energy Inc | 12.42% | 10/23/2025 |
| CEG UW | Constellation Energy Corp | 8.32% | 11/4/2025 |
| SO UN | Southern Co/The | 7.59% | 10/30/2025 |
| DUK UN | Duke Energy Corp | 6.99% | 11/7/2025 |
| VST UN | Vistra Corp | 4.72% | 11/6/2025 |
| AEP UW | American Electric Power Co Inc | 4.54% | 11/6/2025 |
| SRE UN | Sempra | 4.37% | 11/6/2025 |
| D UN | Dominion Energy Inc | 3.71% | 10/31/2025 |
| XEL UW | Xcel Energy Inc | 3.47% | 10/30/2025 |
| EXC UW | Exelon Corp | 3.38% | 11/4/2025 |
S&P Transportation Select Industry FMC Capped Index
| Ticker | Name | Weight in Index | Expected Earnings Release |
| UBER UN | Uber Technologies Inc | 22.83% | 11/4/2025 |
| UNP UN | Union Pacific Corp | 16.22% | 10/23/2025 |
| UPS UN | United Parcel Service Inc | 6.85% | 10/28/2025 |
| CSX UW | CSX Corp | 4.86% | 10/16/2025 |
| NSC UN | Norfolk Southern Corp | 4.72% | 10/23/2025 |
| FDX UN | FedEx Corp | 4.61% | 12/18/2025 |
| ODFL UW | Old Dominion Freight Line Inc | 4.17% | 10/29/2025 |
| DAL UN | Delta Air Lines Inc | 4.03% | 10/9/2025 |
| UAL UW | United Airlines Holdings Inc | 3.95% | 10/15/2025 |
| LUV UN | Southwest Airlines Co | 2.65% | 10/22/2025 |
S&P Retail Select Industry Index
| Ticker | Name | Weight in Index | Expected Earnings Release |
| ODP UW | ODP Corp/The | 1.75% | 11/6/2025 |
| EYE UW | National Vision Holdings Inc | 1.69% | 11/6/2025 |
| ETSY UW | Etsy Inc | 1.69% | 10/30/2025 |
| REAL UW | RealReal Inc/The | 1.64% | 11/4/2025 |
| VSCO UN | Victoria's Secret & Co | 1.64% | 12/5/2025 |
| ULTA UW | Ulta Beauty Inc | 1.53% | 12/4/2025 |
| PSMT UW | PriceSmart Inc | 1.52% | 10/30/2025 |
| CHWY UN | Chewy Inc | 1.52% | 12/4/2025 |
| ASO UW | Academy Sports & Outdoors Inc | 1.51% | 12/10/2025 |
| DDS UN | Dillard's Inc | 1.49% | 11/14/2025 |
S&P Oil & Gas Exploration & Production Select Industry Index
| Ticker | Name | Weight in Index | Expected Earnings Release |
| CNX UN | CNX Resources Corp | 2.96% | 10/30/2025 |
| MUR UN | Murphy Oil Corp | 2.95% | 11/5/2025 |
| RRC UN | Range Resources Corp | 2.91% | 10/28/2025 |
| EXE UW | Expand Energy Corp | 2.89% | 10/29/2025 |
| EQT UN | EQT Corp | 2.83% | 10/21/2025 |
| FANG UW | Diamondback Energy Inc | 2.74% | 11/3/2025 |
| APA UW | APA Corp | 2.71% | 11/6/2025 |
| AR UN | Antero Resources Corp | 2.67% | 10/30/2025 |
| MPC UN | Marathon Petroleum Corp | 2.66% | 11/4/2025 |
| VLO UN | Valero Energy Corp | 2.63% | 10/23/2025 |
S&P Regional Banks Select Industry Index
| Ticker | Name | Weight in Index | Expected Earnings Release |
| CADE UN | Cadence Bank | 2.14% | 10/20/2025 |
| FHN UN | First Horizon Corp | 2.05% | 10/15/2025 |
| VLY UW | Valley National Bancorp | 2.04% | 10/23/2025 |
| BPOP UW | Popular Inc | 2.03% | 10/23/2025 |
| CFG UN | Citizens Financial Group Inc | 2.02% | 10/15/2025 |
| FNB UN | FNB Corp/PA | 1.99% | 10/16/2025 |
| EWBC UW | East West Bancorp Inc | 1.98% | 10/21/2025 |
| SSB UN | SOUTHSTATE BANK CORP | 1.98% | 10/22/2025 |
| TFC UN | Truist Financial Corp | 1.97% | 10/17/2025 |
| COLB UW | Columbia Banking System Inc | 1.97% | 10/30/2025 |
Dow Jones U.S. Select Aerospace & Defense Index
| Ticker | Name | Weight in Index | Expected Earnings Release |
| GE UN | General Electric Co | 21.04% | 10/21/2025 |
| RTX UN | RTX Corp | 14.79% | 10/21/2025 |
| BA UN | Boeing Co/The | 8.14% | 10/29/2025 |
| LHX UN | L3Harris Technologies Inc | 4.62% | 10/30/2025 |
| LMT UN | Lockheed Martin Corp | 4.60% | 10/21/2025 |
| NOC UN | Northrop Grumman Corp | 4.57% | 10/21/2025 |
| GD UN | General Dynamics Corp | 4.45% | 10/24/2025 |
| HWM UN | Howmet Aerospace Inc | 4.33% | 10/30/2025 |
| TDG UN | TransDigm Group Inc | 4.15% | 11/7/2025 |
| AXON UW | Axon Enterprise Inc | 4.04% | 11/7/2025 |
NYSE FANG+ Index
| Ticker | Name | Weight in Index | Expected Earnings Release |
| CRWD UW | Crowdstrike Holdings Inc | 11.23% | 11/26/2025 |
| NVDA UW | NVIDIA Corp | 10.90% | 11/19/2025 |
| AAPL UW | Apple Inc | 10.60% | 10/30/2025 |
| MSFT UW | Microsoft Corp | 10.10% | 10/30/2025 |
| AVGO UW | Broadcom Inc | 9.79% | 12/12/2025 |
| NFLX UW | Netflix Inc | 9.70% | 10/21/2025 |
| GOOGL UW | Alphabet Inc | 9.62% | 10/29/2025 |
| AMZN UW | Amazon.com Inc | 9.54% | 10/31/2025 |
| NOW UN | ServiceNow Inc | 9.44% | 10/29/2025 |
| META UW | Meta Platforms Inc | 9.08% | 10/29/2025 |
Single Stock Daily Leveraged & Inverse ETFs
- Direxion Daily AAPL Bull 2X (AAPU) and Bear 1X (AAPD) Shares
- Direxion Daily AMD Bull 2X (AMUU) and Bear 1X (AMDD) Shares
- Direxion Daily AMZN Bull 2X (AMZU) and Bear 1X (AMZD) Shares
- Direxion Daily AVGO Bull 2X (AVL) and Bear 1X (AVS) Shares
- Direxion Daily BA Bull 2X (BOEU) and Bear 1X (BOED) Shares
- Direxion Daily BRKB Bull 2X (BRKU) and Bear 1X (BRKD) Shares
- Direxion Daily CSCO Bull 2X (CSCL) and Bear 1X (CSCS) ETFs
- Direxion Daily LLY Bull 2X (ELIL) and Bear 1X (ELIS) Shares
- Direxion Daily F Bull 2X (FRDU) and Bear 1X (FRDD) ETFs
- Direxion Daily GOOGL Bull 2X (GGLL) and Bear 1X (GGLS) Shares
- Direxion Daily LMT Bull 2X (LMTL) and Bear 1X (LMTS) ETFs
- Direxion Daily META Bull 2X (METU) and Bear 1X (METD) Shares
- Direxion Daily MSFT Bull 2X (MSFU) and Bear 1X (MSFD) Shares
- Direxion Daily MU Bull 2X (MUU) and Bear 1X (MUD) Shares
- Direxion Daily NFLX Bull 2X (NFXL) and Bear 1X (NFXS) Shares
- Direxion Daily NVDA Bull 2X (NVDU) and Bear 1X (NVDD) Shares
- Direxion Daily PANW Bull 2X (PALU) and Bear 1X (PALD) Shares
- Direxion Daily PLTR Bull 2X (PLTU) and Bear 1X (PLTD) Shares
- Direxion Daily QCOM Bull 2X (QCMU) and Bear 1X (QCMD) ETFs
- Direxion Daily SHOP Bull 2X (SHPU) and Bear 1X (SHPD) ETFs
- Direxion Daily TSLA Bull 2X (TSLL) and Bear 1X (TSLS) Shares
- Direxion Daily TSM Bull 2X (TSMX) and Bear 1X (TSMZ) Shares
- Direxion Daily XOM Bull 2X (XOMX) and Bear 1X (XOMZ) Shares
| Ticker | Name | Bull/Bear Pair | Expected Earnings Release |
| MSFT UW | MICROSOFT CORP | MSFU/MSFD | 10/30/2025 |
| TSLA UW | TESLA INC | TSLL/TSLS | 10/22/2025 |
| AAPL UW | APPLE INC | AAPU/AAPD | 10/30/2025 |
| GOOGL UW | ALPHABET INC-CL A | GGLL/GGLS | 10/29/2025 |
| AMZN UW | AMAZON.COM INC | AMZU/AMZD | 10/31/2025 |
| NVDA UW | NVIDIA CORP | NVDU/NVDD | 11/19/2025 |
| META UW | META PLATFORMS INC-CLASS A | METU/METD | 10/29/2025 |
| NFLX UW | NETFLIX INC | NFXL/NFXS | 10/21/2025 |
| TSM UN | TAIWAN SEMICONDUCTOR-SP ADR | TSMX/TSMZ | 10/16/2025 |
| MU UW | MICRON TECHNOLOGY INC | MUU/MUD | 12/18/2025 |
| AVGO UW | BROADCOM INC | AVL/AVS | 12/12/2025 |
| PLTR UW | PALANTIR TECHNOLOGIES INC-A | PLTU/PLTD | 11/4/2025 |
| BRK/B UN | BERKSHIRE HATHAWAY INC-CL B | PLTU/PLTD | 11/3/2025 |
| AMD UW | ADVANCED MICRO DEVICES | AMUU/AMDD | 11/4/2025 |
| PANW UW | PALO ALTO NETWORKS INC | PALU/PALD | 11/20/2025 |
| LLY UN | ELI LILLY & CO | ELIL/ELIS | 10/30/2025 |
| BA UN | BOEING CO/THE | BOEU/BOED | 10/29/2025 |
| XOM UN | EXXON MOBIL CORP | XOMX/XOMZ | 10/31/2025 |
| CSCO UW | CISCO SYSTEMS INC | CSCL/CSCS | 11/13/2025 |
| QCOM UW | QUALCOMM INC | QCMU/QCMD | 11/6/2025 |
| F UN | FORD MOTOR CO | FRDU/FRDD | 10/23/2025 |
| SHOP UW | SHOPIFY INC - CLASS A | SHPU/SHPD | 10/30/2025 |
| LMT UN | LOCKHEED MARTIN CORP | LMTL/LMTS | 10/21/2025 |
*Definitions and Index Descriptions
Index Descriptions
- S&P 500® Index (SPXT) - Standard & Poor’s® selects the stocks comprising the S&P 500® Index (SPXT) on the basis of market capitalization, financial viability of the company and the public float, liquidity and price of a company’s shares outstanding. The Index is a float-adjusted, market capitalization-weighted index.
- S&P 500® High Beta Index (SP5HBIT) - Provided by S&P Dow Jones Indices (the "Index Provider"), which selects 100 securities to include in the Index from the S&P 500® Index that have the highest sensitivity to market movements, or “beta” over the past 12 months as determined by the Index Provider. Securities with the highest beta are generally the most volatile securities of the S&P 500® Index.
- Financial Select Sector Index (IXMTR) - Provided by S&P Dow Jones Indices and includes securities of companies from the following industries: Banks; Thrifts & Mortgage Finance; Diversified Financial Services; Consumer Finance; Capital Markets; Insurance; and Mortgage Real Estate Investment Trusts (REITs).
- Health Care Select Sector Index (IXVTR) - Provided by Standard & Poor’s and includes domestic companies from the healthcare sector, which includes the following industries: pharmaceuticals; health care equipment and supplies; health care providers and services; biotechnology; life sciences tools and services; and health care technology.
- Industrials Select Sector Index (IXITR) - Provided by S&P Dow Jones Indices and includes domestic companies from the industrials sector which includes the following industries: aerospace and defense; industrial conglomerates; marine; transportation infrastructure; machinery; road and rail; air freight and logistics; commercial services and supplies; professional services; electrical equipment; construction and engineering; trading companies and distributors; airlines; and building products.
- Indxx Magnificent 7 Index (IFOTQ) - Provided by Indxx and is designed to track the performance of the seven largest NASDAQ listed companies.
- Real Estate Select Sector Index (IXRETR) - Provided by S&P Dow Jones Indices (the “Index Provider”) and includes securities of companies from the following industries: real estate management and development and real estate investment trusts (“REITs”), excluding mortgage REITs.
- Dow Jones Internet Composite Index (DJINETT) - Provided by S&P Dow Jones Indices and includes companies that generate at least 50% of their annual sales/revenue from the internet as determined by the Index Provider. Additionally, each stock must have a minimum of three months’ trading history and a three month average market capitalization of at least $100 million. The Index consists of 40 stocks from two different sectors, internet commerce and internet services
- S&P Biotechnology Select Industry Index (SPSIBITR) - Provided by S&P Dow Jones Indices LLC and includes domestic companies from the biotechnology industry. The Index is a modified equal – weighted index that is designed to measure the performance of the biotechnology sub-industry based on the Global Industry Classification Standards (GICS).
- NYSE Semiconductor Index (ICESEMIT) - A rules-based, modified float-adjusted market capitalization-weighted index that tracks the performance of the thirty largest U.S. listed semiconductor companies.
- Dow Jones U.S. Select Home Construction Index (DJSHMBT) - Measures U.S companies in the home construction sector that provide a wide range of products and services related to homebuilding, including home construction and producers, sellers and suppliers of building materials, furnishings and fixtures and also home improvement retailers. The Index may include large-, mid- or small-capitalization companies.
- NASDAQ 100® Equal Weighted Index (NETR) - Includes 100 of the largest non-financial securities listed on NASDAQ®, but instead of being weighted by market capitalization, each of the constituents is initially set at 1.00%.
- S&P Mid Cap 400® Index (SPTRMDCP) - Measures the performance of 400 mid-sized companies in the United States. The Index is a free-float adjusted market capitalization-weighted index composed of liquid common stocks.
- Russell 2000® Index (RU20INTR) - Measures the performance of approximately 2,000 small-capitalization companies in the Russell 3000® Index, based on a combination of their market capitalization.
- Technology Select Sector Index (IXTTR) - Provided by S&P Dow Jones Indices and includes domestic companies from the technology sector which includes the following industries: computers and peripherals; software; diversified telecommunications services; communications equipment; semiconductors and semi-conductor equipment; internet software and services; IT services; electronic equipment, instruments and components; wireless telecommunication services; and office electronics.
- Energy Select Sector Index (IXETR) - Provided by S&P Dow Jones Indices and includes domestic companies from the energy sector which includes the following industries: oil, gas and consumable fuels; and energy equipment and services.
- Utilities Select Sector Index (IXUTR) - Provided by S&P Dow Jones Indices and includes domestic companies from the utilities sector which includes the following industries: electric utilities; multi-utilities; water utilities; independent power producers and energy trades; and gas utilities.
- S&P Transportation Select Industry FMC Capped Index (SPTSCUT) - Provided by S&P Dow Jones Indices and is designed to measure stocks in the S&P Total Market Index that are included in the GICS transportation sub-industry.
- S&P Retail Select Industry Index (SPSIRETR) - A modified equal-weighted index that is designed to measure performance of the stocks comprising the S&P Total Market Index that are classified in the Global Industry Classification Standard (GICS) retail sub-industry.
- S&P Oil & Gas Exploration & Production Select Industry Index (SPSIOPTR) - Provided by Standard & Poor’s Index Provider and includes domestic companies from the oil and gas exploration and production sub industry. The Index is a modified equal weighted index that is designed to measure the performance of a sub industry or group of sub industries determined based on the Global Industry Classification Standards (GICS).
- S&P Regional Banks Select Industry Index (SPSIRBKT) - A modified equal-weighted index that is designed to measure performance of the stocks comprising the S&P Total Market Index that are classified in the Global Industry Classification Standard (GICS) regional banks sub-industry.
- Dow Jones U.S. Select Aerospace & Defense Index (DJSASDT) - Provided by Dow Jones U.S. Index (the “Index Provider”). The Index attempts to measure the performance of the aerospace and defense industry of the U.S. equity market. The Index Provider selects the stocks comprising the Index from the aerospace and defense sector on the basis of the float-adjusted, market capitalization-weight of each constituent. Aerospace companies include manufacturers, assemblers and distributors of aircraft and aircraft parts. Defense companies include producers of components and equipment for the defense industry, such as military aircraft, radar equipment and weapons.
- NYSE FANG+ Index (NYFANGT) - An equal-dollar weighted Index designed to track the performance of 10 highly-traded growth stocks of technology and tech-enabled companies. The Index is comprised of the securities of U.S.-listed companies that ICE Data Indices, LLC (the “Index Provider”) has identified as FANG+ companies, which are comprised of the six FAANMG companies and four non-FAANMG companies. The Index Provider defines the FAANMG as Meta Platforms Inc. (META), Apple Inc. (AAPL), Amazon.com Inc. (AMZN), Netflix Inc. (NFLX), Microsoft Corp. (MSFT), and Alphabet Inc. Class A (GOOGL). The Index is reconstituted quarterly.
An investor should carefully consider a Fund’s investment objective, risks, charges, and expenses before investing. A Fund’s prospectus and summary prospectus contain this and other information about the Direxion Shares. To obtain a Fund’s prospectus and summary prospectus call 866-476-7523 or visit our website at direxion.com. A Fund’s prospectus and summary prospectus should be read carefully before investing.
Direxion Shares ETF Risks – An investment in the ETFs involves risk, including the possible loss of principal. The ETFs are non-diversified and include risks associated with concentration that results from an ETF’s investments in a particular industry, sector or company, which can increase volatility. The use of derivatives such as futures contracts and swaps are subject to market risks that may cause their price to fluctuate over time. The ETFs do not attempt to, and should not be expected to, provide returns which are a multiple of respective underlying security for periods other than a single day. For other risks including leverage, correlation, daily compounding, market volatility and risks specific to an industry, sector or company, please read the prospectus.